The U.S. and China remain deadlocked in a major trade dispute. While many sectors have been impacted, the U.S. agricultural sector has paid a heavy price in the dispute. The first major impact on U.S. agriculture came in July 2018 when China imposed a 25 percent retaliatory tariff on many U.S. agricultural products.

U.S. Ag Impacts
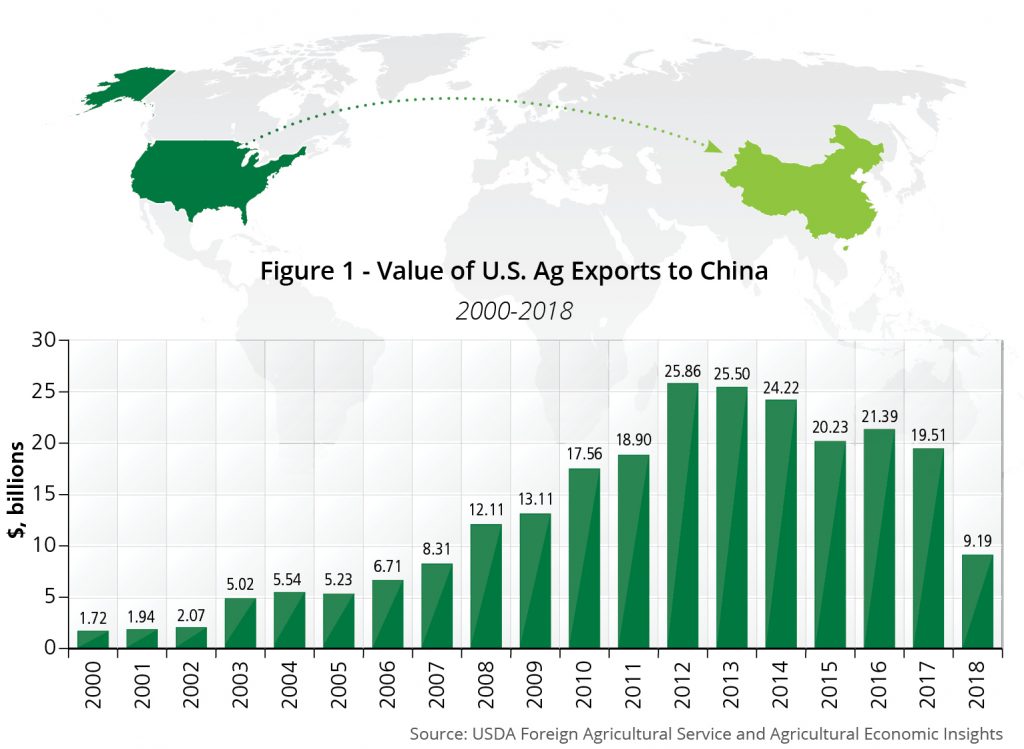
China is a major export destination for U.S. agricultural products. In 2017 it ranked just behind Canada as the second most valuable U.S. ag export destination, accounting for $19.5 billion of exports. Among the most important exports in 2017 were soybeans ($12 billion), cotton ($971 million), grain sorghum ($835 million), dairy products ($579 million), red meat and products ($561 million), wheat ($378 million), cherries ($122 million), almonds ($101 million), and vegetables ($154 million).1
The result of the Chinese retaliatory tariffs has been a steep drop (-53% from 2017 levels) in the value of U.S. ag exports to China (figure 1). Given the inelastic demand of agricultural commodities, large declines in prices for most agricultural products have occurred.

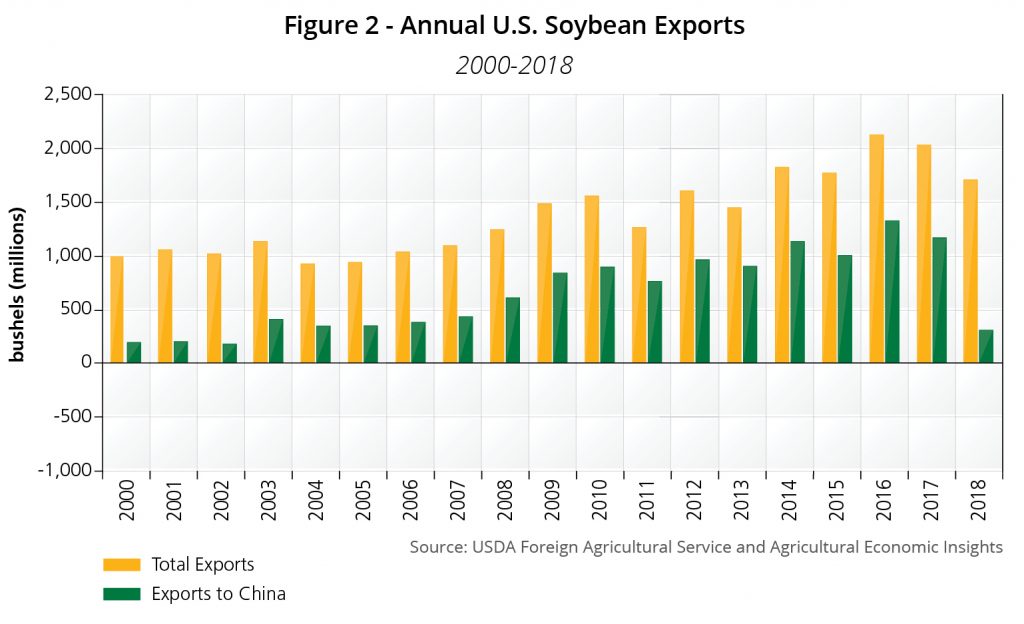
Soybeans are by far the most impacted U.S. commodity. The experience for soybeans has been particularly painful for U.S. soybean producers. The Chinese soybean market has been a source of dramatic growth over the last 20 years. The market grew from 192 million bushels in 2000 to its peak of 1.3 billion bushels in 2016. In 2016 Chinese exports accounted for 62% of all U.S. soybean exports. In 2018, export levels fell back to levels last seen in 2003.
The result in the loss of this important export market has been a decline in prices as supply chains were forced to readjust to new market fundamentals. These adjustments include reallocating acreage to other crops and adjusting export destinations. The decline in prices comes at a time when the U.S. farm economy was already struggling to adjust to oversupply problems and weak farm economic conditions.
As a result, the U.S. has been forced to provide ad hoc tariff aid payments in an effort to stabilize U.S. farm economic conditions. These payments have been significant. USDA has earmarked $23 billion of trade adjustment payments ($8.59 billion in round 1 and $14.5 billion in round 2). Without resolution of the trade war, it is likely that additional payments will be required to stabilize the farm economy.

The Chinese Impacts
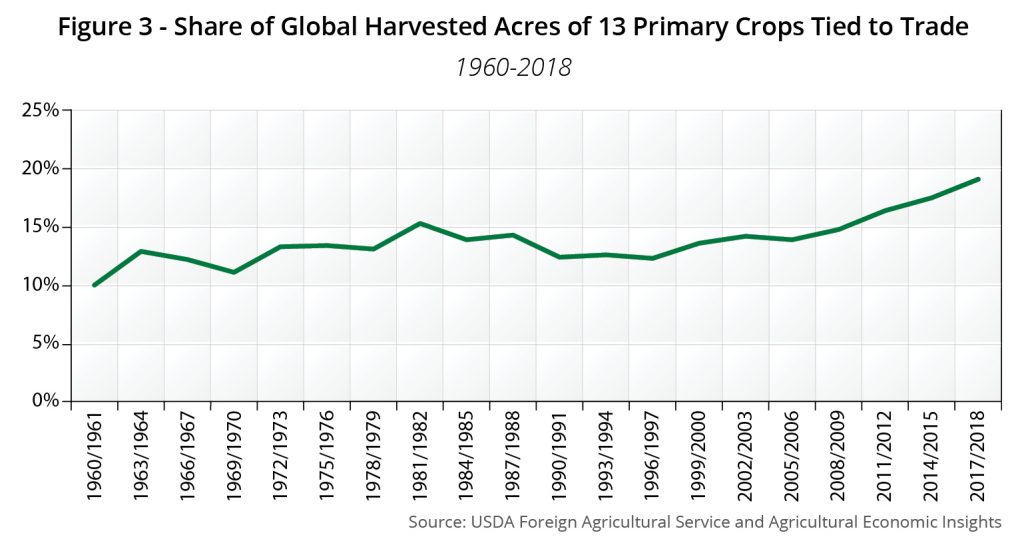
The recent Chinese/US trade dispute flies in the face of a major trend toward a more globally intertwined agricultural production system. The amount of agricultural trade has steadily increased for some time. Figure 3 shows the share of global harvested acres that are tied to trade for 13 primary crops.2 This total has steadily increased from the 1960’s to mid-1980’s and then again from the mid 1990’s to today. For the 2017/2018 crop year, nearly 20 percent of globally harvested acres of these crops were exported.

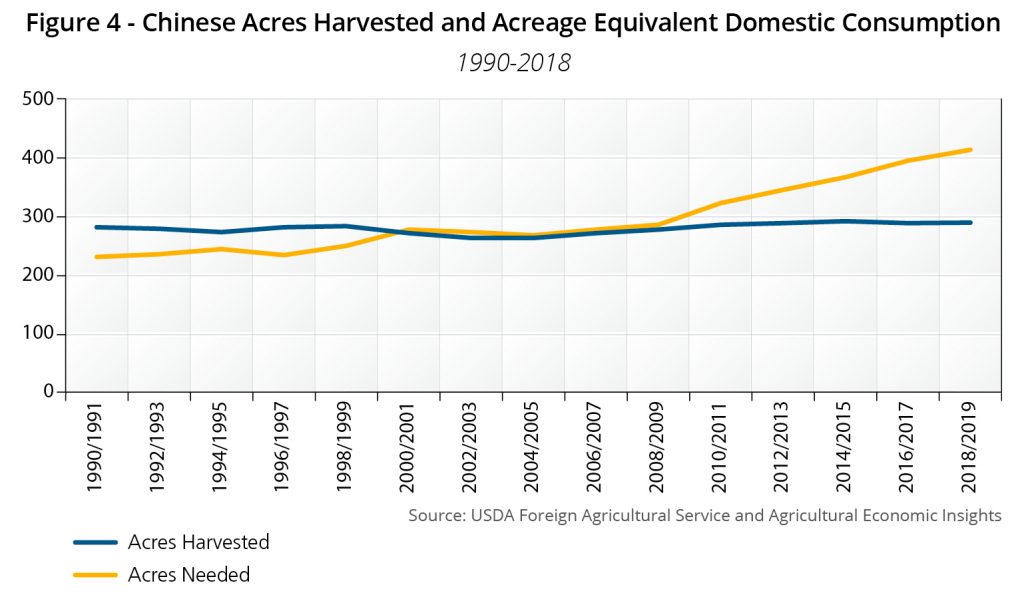
The reliance on agricultural trade can clearly be seen by the Chinese experience. In recent years China has relied upon imports to meet domestic demand. Figure 4 shows China’s total harvested acres for 13 primary crops since 1990 (in blue). Over the last three decades, the amount of acres of agricultural production in China has held steadily at 290 million acres. For the current year (2018/2019), China is expected to harvest 288.8 million acres of these crops, or 12.5 percent of the global total.

Also shown in Figure 4, in orange, is domestic consumption of these thirteen-crops converted to acres.3 The Chinese situation has evolved from one of domestic surplus from 1990-2000, to self-sufficiency from 2000-2009, to necessitating imports since 2009. In recent years, the acreage equivalent domestic consumption has far outpaced harvested acres.
The implication of consumption outpacing production is that China has relied heavily on imports. While this isn’t a new story, it’s perhaps a different way to think about the magnitude of China’s reliance on imports. Today, the acreage equivalent consumption of these commodities is 413 million acres, roughly 100 million acres more than their production capacity for these crops.

What Does It Mean?
The current China/U.S. trade war is obviously weighing heavily on the U.S. farm sector. From an economic perspective there are a few key things that can be concluded. First, let’s consider who loses in the trade war. The most obvious losers are U.S. farm producers who are losing access to a large and growing marketplace for their products. While other countries will fill the market and U.S. soybeans will flow to other markets, the transaction and transportation costs associated with realigning the movement of agricultural products to other markets are significant and will ultimately be borne by U.S. producers.
The other major losers in the trade dispute are Chinese buyers of U.S. ag exports. These buyers are now forced to find other more expensive places to purchase their products. In the case of soybeans, this is particularly difficult as the Chinese demand accounts for nearly all the remaining exportable soybean supplies in the world. In short, the trade war has the impact of increasing commodity prices in China, which in turn reduces overall demand.
On the other side of the ledger, the clear winners in this dispute are all other nations that are capable of exporting agricultural goods to China. These producers will increasingly find that prices for their commodities are higher and will be further incentivized to add to production capacity. Additionally, other countries that import agricultural goods should see the benefit of reduced prices on U.S. agricultural goods.
As we move forward, the China/U.S. trade dispute is causing a major disruption in the economics of agricultural production around the world. In the long-term, the most concerning impact is that it is further encouraging an expansion of agricultural production around the world, but in particular South America. As these additional production resources come on-line, it will likely add to already burdensome supplies and may produce a supply overhang that will last well after the trade dispute’s resolution.
It is clear that U.S. agricultural producers and farmland owners would benefit from a resolution of the trade war. Whether a resolution is forthcoming is difficult to predict. It seems that the finish line of the negotiations is perpetually moving further from sight. The uncertainty associated with the trade war is substantial. It is unclear how/when it will be resolved. Furthermore, one has to wonder how long it would take to realize any potential benefits, or wins, from a resolution. If the trade war were to last indefinitely, one should expect major pain and realignment in the U.S. farm sector, particularly in the row crop sectors. These producers will be forced to continue to change commodity mixes and realign production. This will be economically painful. If the situation persists the government will be required to continue to make large “adjustment” outlays to agriculture, or see farm incomes sink.
On the other hand, a resolution to the trade war would be welcome. It is possible that the resolution will open/improve markets for additional U.S. ag commodities including ethanol, meat, and feed grains. This would be welcome and could position the U.S. favorably for the future. However, at this point it seems reasonable to have cautious expectations for such an outcome.
One can hope that both sides will eventually come to a resolution. In the meantime, one should be cautious about the economic prospects for agricultural products that are highly reliant upon Chinese exports for demand.

We are honored to have two guest authors for this article.
Brent Gloy is an agricultural economist specializing in agricultural finance and agribusiness management. The majority of his research has focused on issues related to the supply and demand for credit and farmland values. His research has been quoted and referenced in media ranging from the farm press, to the Wall Street Journal, New York Times, the Economist, Bloomberg, Reuters, USA Today, and Barron’s, among others. Brent founded and served as the first Director of Purdue’s Center for Commercial Agriculture.
Dr. Gloy has held tenured faculty positions in agricultural economics at Purdue University and Cornell University. He is currently operating his family farming operation in Southwest Nebraska. Brent received his master’s degree and doctorate in agricultural economics from Purdue University and his undergraduate degree from the University of Nebraska-Lincoln.
David Widmar is an agricultural economist in the Center for Commercial Agriculture in the Department of Agricultural Economics. He specializes in agricultural trends and producer decision-making. Through his research, David supports agribusinesses and farmers in their strategic and planning efforts. His work has been featured in several agricultural media publications, university publications, webinars and agribusiness conferences. David leads the research activities for the Purdue/CME Group Ag Economy Barometer. David received his bachelor’s degree from Kansas State University and his master’s degree from Purdue University, both in agricultural economics.
Agricultural Economic Insights, LLC was founded in 2014 by Dr. Brent Gloy and David Widmar. Recognizing an opportunity to provide timely, in-depth analysis about key agricultural economy trends, Brent and David began by writing weekly articles focused on insights. In addition to the Weekly Insights articles, Brent and David regularly speak at farm and agribusiness events, focusing on key trends impacting the farm economy. AEI.ag also provides the Crop Budget Outlook – forwarding looking crop budget estimates and commentary to help with key strategic and planning activities.
1. Foreign agricultural trade of the United States (FATUS): Country-specific data
2. The 13 primary crops are: barley, corn, cotton, millet, oats, peanuts, rapeseed, soybeans, sunflowers, rice (milled), rye, sorghum, wheat.
Disclaimer: Our belief of future market performance is based on expectations that may or may not come true. Investors should perform their own due diligence before undertaking farmland investments.


