


VOLUME 10 • THIRD QUARTER, 2026
Welcome to our State of the Market Report
Our annual State of the Market report offers an overview of the trends and forces influencing farmland returns and explores how these factors affect current and future investment performance. We examine the National Council of Real Estate Investment Fiduciaries (NCREIF) Farmland Index and provide context on the farmland asset class’s recent and projected performance. We then turn to permanent crops, where the almond and pistachio industries have spent the past decade contending with a strong dollar, retaliatory tariffs, and persistent oversupply, but are showing improvement in returns. The events of 2026 have changed that outlook again. Tree-nut shipments have been rerouted around the Strait of Hormuz, a new trade agreement has further opened the European market, and the Sustainable Groundwater Management Act (SGMA) is beginning to separate orchards with secure water from those without. The green shoots are real; whether they take root is the question this report explores.
The First Green Shoots of Recovery
AgIS Capital Research (ACR) titled last year’s State of the Market, “Into the Abyss.” U.S. farmland had just recorded its first negative annual total return on record, and the macroeconomic backdrop offered little comfort. Twelve months on, the abyss has a floor. The U.S. agricultural sector’s net farm income in 2026 is forecast, in real terms, to have reached the seventh highest level since 1960, farm-sector equity is on track to rise for a seventh consecutive year, the NCREIF Total Farmland Index (TFI) returned to positive territory, and almond and pistachio prices have moved sharply higher during the 2025 crop marketing year. Yet the recovery is narrow and unevenly rooted, owing as much to a near-record level of direct government payments as to the underlying strength of commodity markets. The forces that clouded the 2025 outlook have not gone away. The dollar remains historically strong, inflation persists above the Federal Reserve’s two percent target, and the U.S. trade deficit is still substantial despite narrowing from its 2025 pace. But 2026 has brought a far more consequential shock: the conflict with Iran and the closure of the Strait of Hormuz sent energy prices and some agricultural inputs sharply higher, pushed inflation higher, and upended many of the assumptions underlying the forecasts by the United States Department of Agriculture (USDA) in the first section of this report.

The exogenous story of 2026 is written in energy and interest rates.
The exogenous story of 2026 is written in energy and interest rates. In late February, just weeks after the USDA’s Economic Research Service (ERS) released its farm-income forecast, the conflict with Iran sharply curtailed traffic through the Strait of Hormuz, a route that carried roughly one-quarter of the world’s seaborne oil trade in 2025, and drove energy prices sharply higher. Consumer price inflation, which had been easing, reversed course and reached 4.2 percent in May, its highest rate since 2023. Inflation eased in June and July but accelerated again in August. Consumer prices rose 0.4 percent during the month and were 3.4 percent higher than in August 2025. Energy prices increased 2.1 percent in August and were 16.3 percent higher than a year earlier. Oil flows through the Strait have begun to recover. The U.S. Energy Information Administration (EIA) expects export constraints to persist through the end of 2026. Much of the 2026 outlook rests on this single, unresolved geopolitical variable.
The Federal Reserve followed the shift that emerged in July by raising its rate by 25 bps at its September meeting. At Kevin Warsh’s third meeting as Chair, the FOMC raised the federal funds target range to 3.75 to 4.00 percent. The vote was unanimous, 12-to-0, and marked the first increase since 2023. The Fed’s next decision will hinge largely on whether higher energy costs remain confined to fuel and whether inflation elsewhere begins to ease. For farmland investors, the increase raises the opportunity cost of capital and puts upward pressure on return expectations.
The dollar lost some ground in August. Agricultural exporters benefited from the decline, but relatively high U.S. interest rates continue to support the currency. For tree nuts, the exchange rate matters because foreign consumers buy most U.S. tree nuts and must pay more in their own currencies even when the dollar price has not changed. USDA expects the United States to import $204.5 billion in agricultural products during fiscal year 2026. Exports are forecast at $179.5 billion, leaving a $25.0 billion deficit. U.S. agricultural trade has remained in deficit since fiscal year 2023. After accounting for inflation, the projected decline in exports would mark the fourth consecutive year.
Trends
The ERS released its updated forecast for 2026 farm-sector income on September 3rd, 2026.
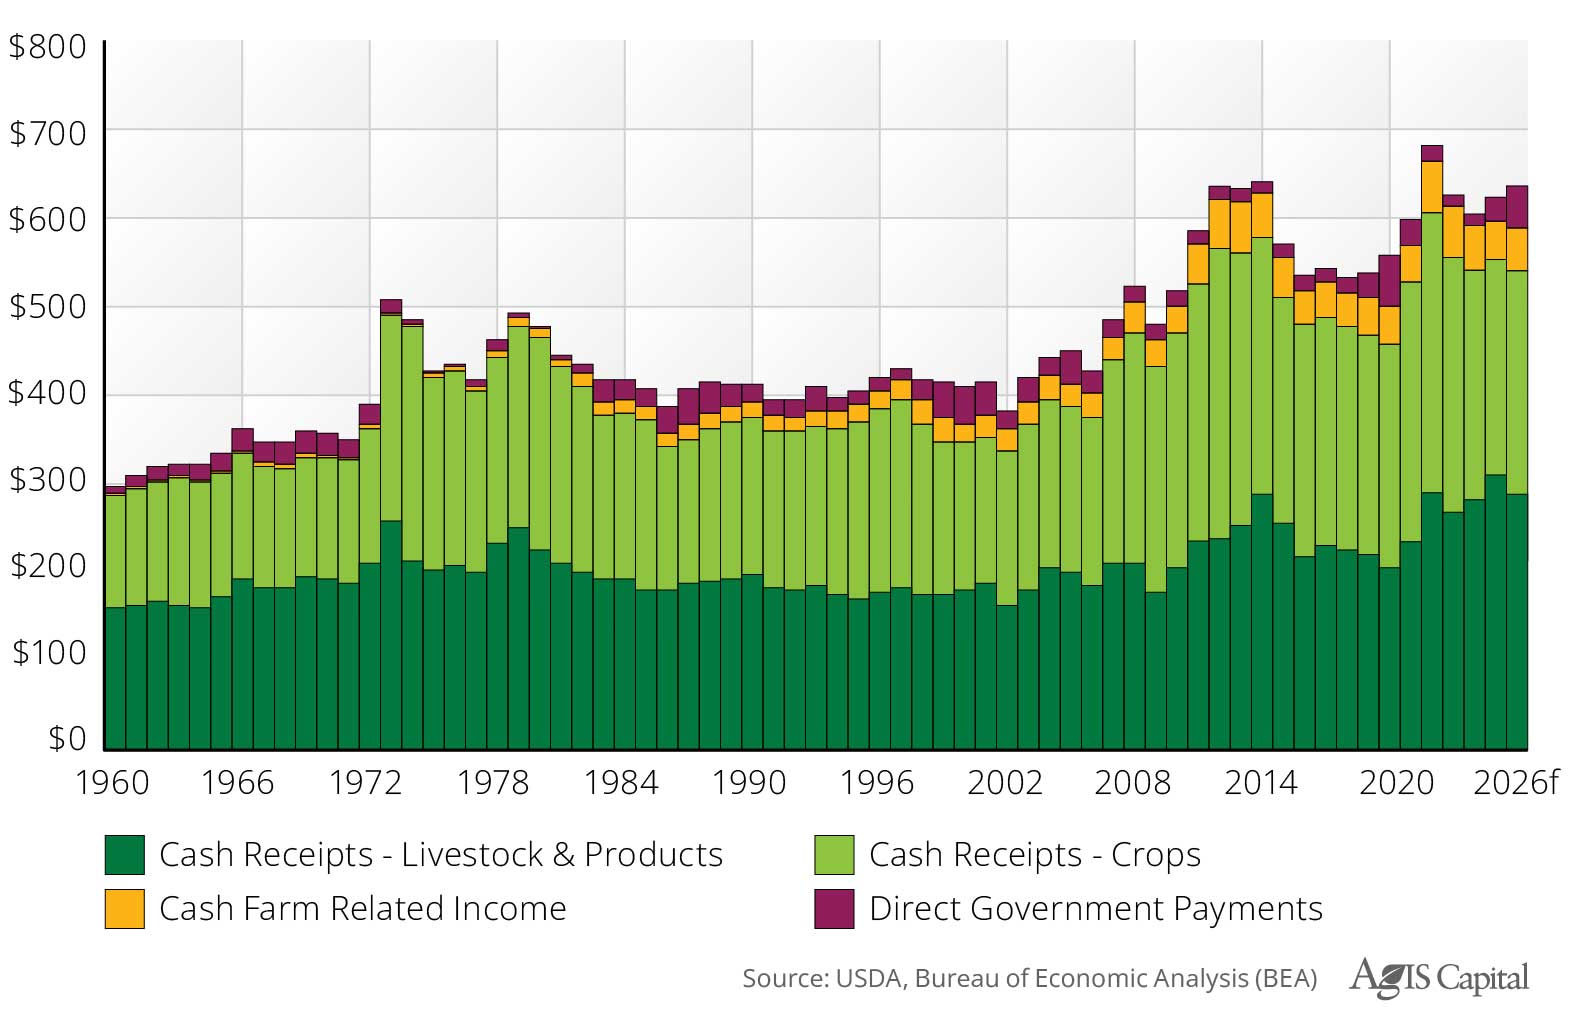
Gross cash income in real terms is projected to increase 1.8 percent to $635.1 billion (bb) in 2026, down 6.6 percent from the record $679.9bb accrued in 2022.
Cash receipts from crops are expected to increase 4.1 percent to $253.0bb, while receipts from livestock are expected to fall 7.2 percent to $287.3bb. In comparison, farm-related income and direct government payments are expected to increase 11.2 and 66.5 percent, respectively, in real terms. The estimated $47.4bb in direct government payments would be the second-highest amount on record, surpassed only by the $56.9bb in 2020 (see Figure 1).
Figure 1) Real Gross Cash Income Components: 1960 to 2026f, billions, 2026 dollars
In real terms, total production expenses are projected to decline by 1.0 percent, or $4.9bb, to $477.7bb in 2026. An 8.6 percent reduction in feed expenses and a 6.3 percent decrease in pesticides, fertilizer, and fuel offset higher livestock and poultry expenses (see Figure 2).
Figure 2) Real U.S. Farm Income Components: 1960 to 2026f, billions, 2026 dollars

Real gross farm income is forecast to increase 0.7 percent to $651.2bb, while real total production expenses are forecast to increase 2.5 percent to $492.8bb, and, therefore, real net farm income (NFI) is projected to fall 2.7 percent to $158.4bb in 2026. In real terms, the 2026 NFI forecast would be the seventh highest since 1960 if it comes to fruition. The estimate would be 48.6 percent higher than the average from 1960 to 2025 and 16.7 percent higher than the average from 2010 to 2025 (as depicted in Figure 3). The past six years rank among the twelve highest NFIs recorded since 1960.
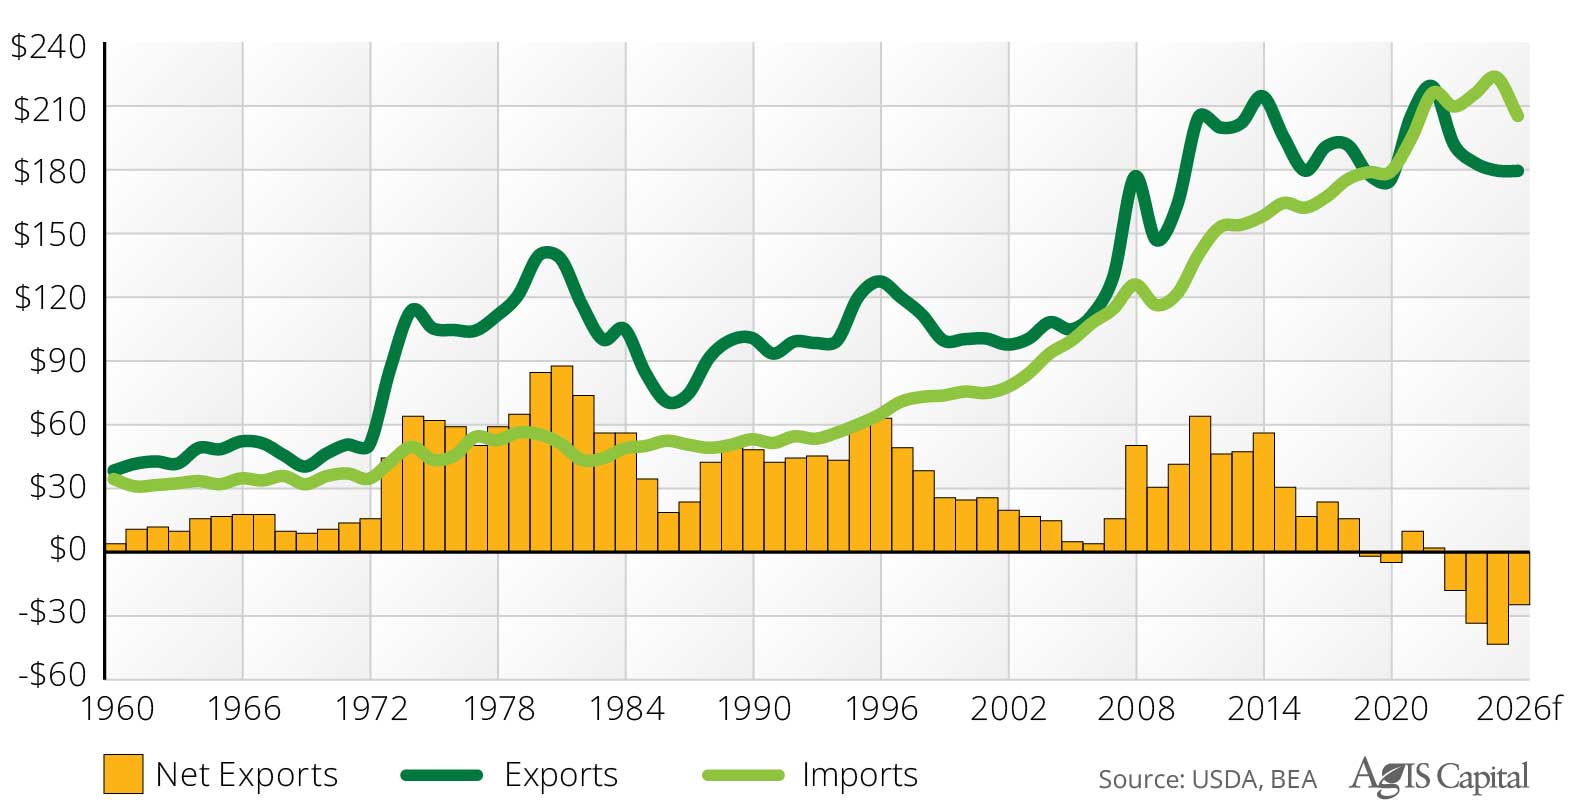
In real terms, U.S. agricultural exports are projected to decline 0.2 percent to $179.5bb. Lower export values for soybeans, soybean oil, and beef and veal are expected to offset much of the increase in corn, tree nut, and dairy exports. This would mark the fifth consecutive decline in the real value of exports, down from a peak value of $218.5bb in 2022. Agricultural imports are forecast to fall 8.5 percent to $204.5bb. This would mark the fourth consecutive year of negative net exports of agricultural commodities and the third-largest trade deficit at $25bb (see Figure 4).
Figure 3) Real U.S. Net Farm Income: 1960 to 2026f, billions, 2026 dollars
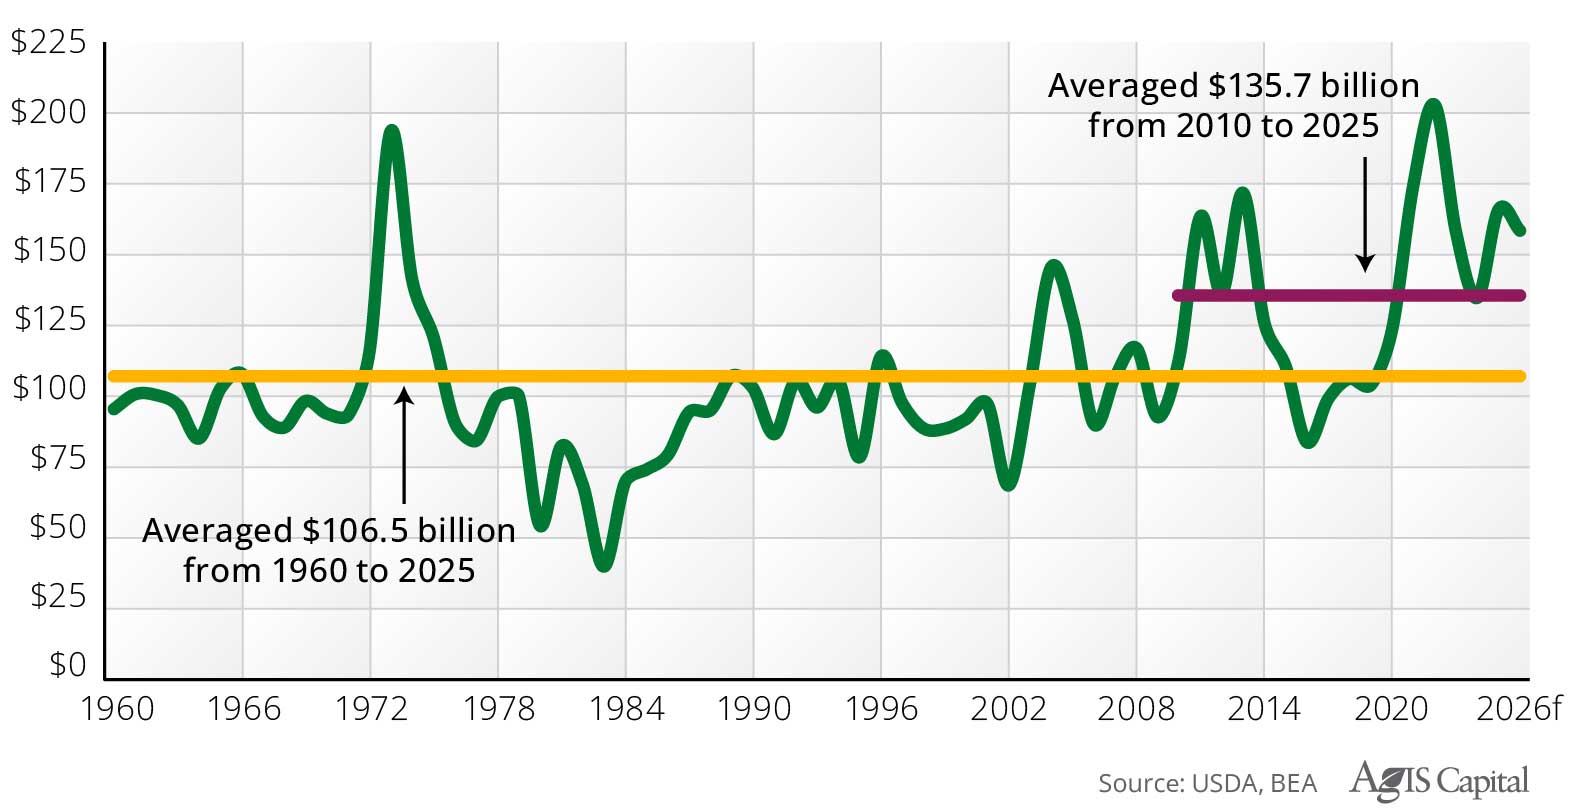
Figure 4) Real U.S. Agriculture Imports and Exports: 1960 to 2026f, billions, 2026 dollars
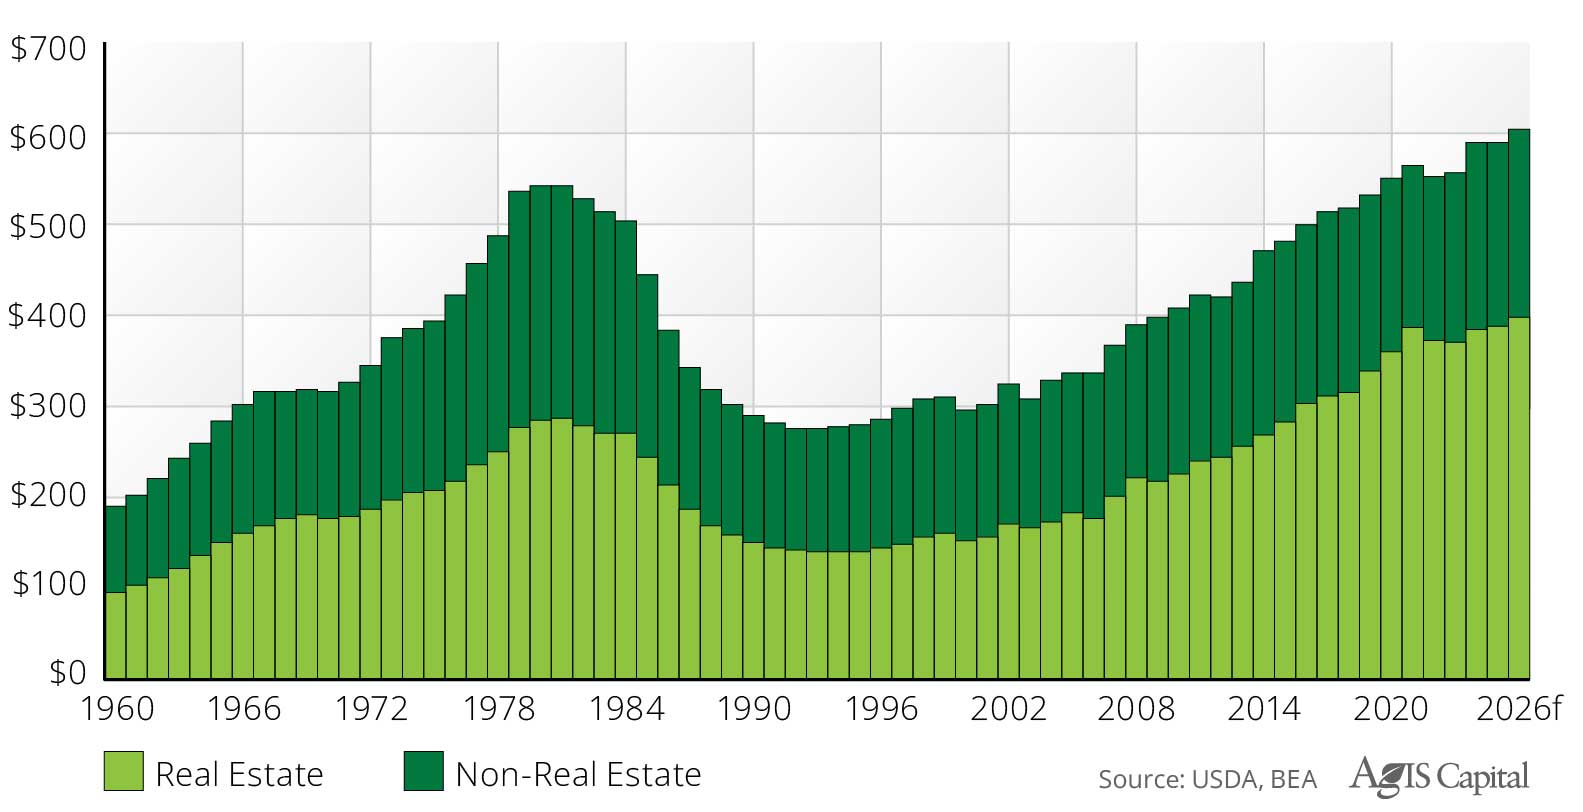
The real inflation-adjusted value of farm sector debt is projected to rise 2.5 percent to $605.1bb. Agricultural real estate debt is expected to grow 2.6 percent to $399.0bb, a record high, while revolving working capital loans are expected to increase 2.4 percent to $206.1bb, which remains 21.1 percent below the 1979 record (see Figure 5). USDA farm income statistics indicate that farm sector debt coverage and repayment capacity have generally held up over the past decade, with the debt service ratio remaining relatively stable. However, coverage could weaken if output prices remain subdued while interest rates and debt-servicing costs remain elevated.
Figure 5) Real U.S. Farm Debt in Real Estate and Non-Real Estate: 1960 to 2026f, billions, 2026 dollars
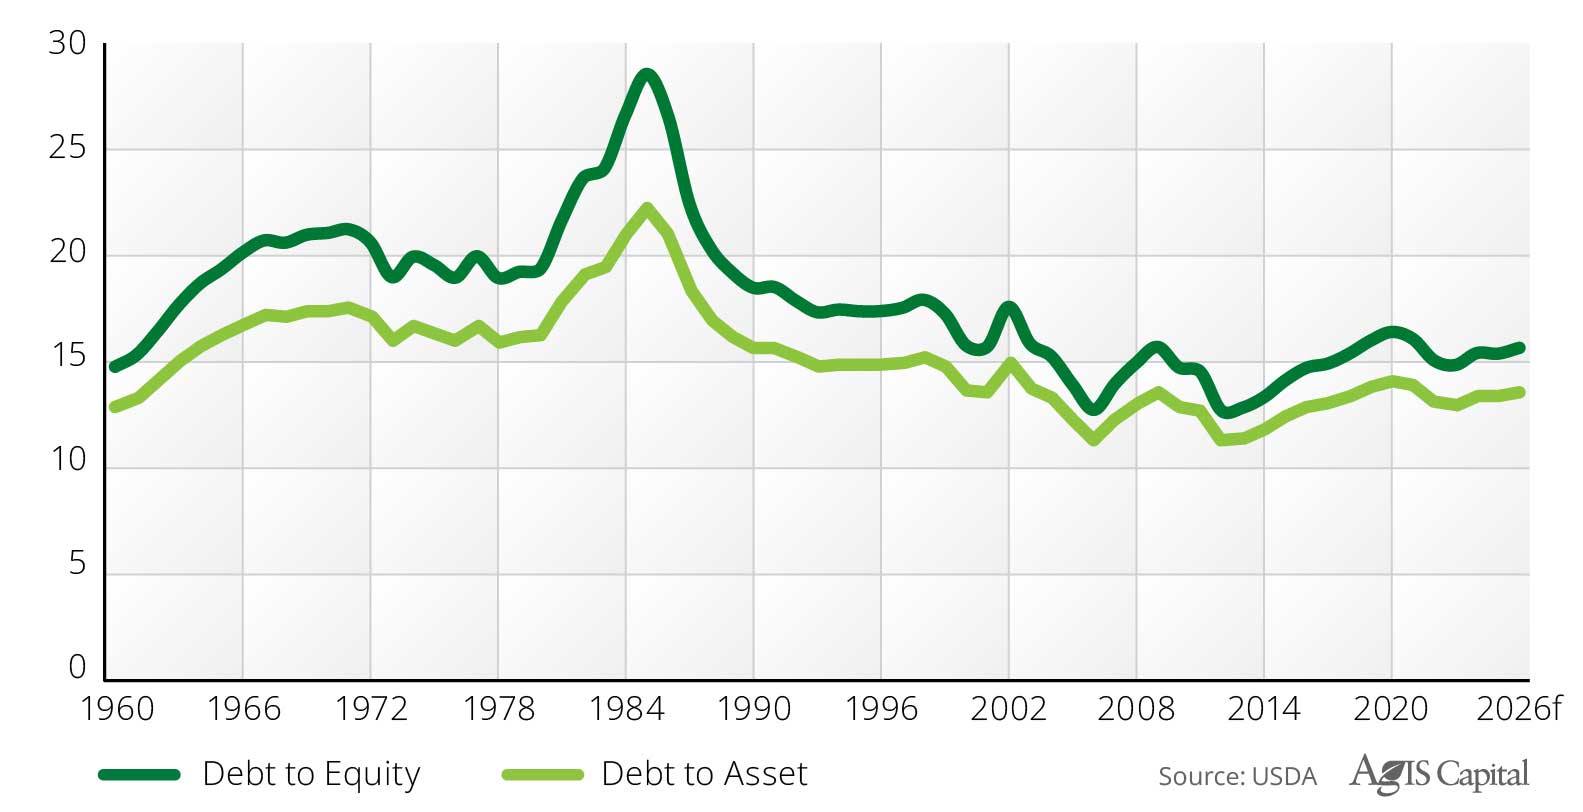
The real value of farm assets is projected to increase 1.0 percent to $4.5 trillion (tt), while the real value of farm real estate is anticipated to grow 1.4 percent to $3.7tt (see Figure 6). For the seventh consecutive year, the real value of farm sector equity is expected to increase in 2026. The value of equity is expected to increase 0.7 percent in 2026 to $3.9tt. The higher proportional increase in the value of debt, in comparison to farm assets and equity, is expected to increase the debt-to-equity and debt-to-asset ratios, which are forecast to be 15.7 percent and 13.5 percent, respectively, as depicted in Figure 7). The USDA’s farm income and balance sheet forecasts offer a high-level overview of the expected profitability of the U.S. agricultural sector and reflect diverse uses, crop types, and geographies. To gain more insight into the current situation, we analyze the NCREIF Farmland Index, which provides more detail on the relative performance of property and crop types.
Figure 6) Real U.S. Farm Assets and Farm Real Estate: 1960 to 2026f, trillions, 2026 dollars
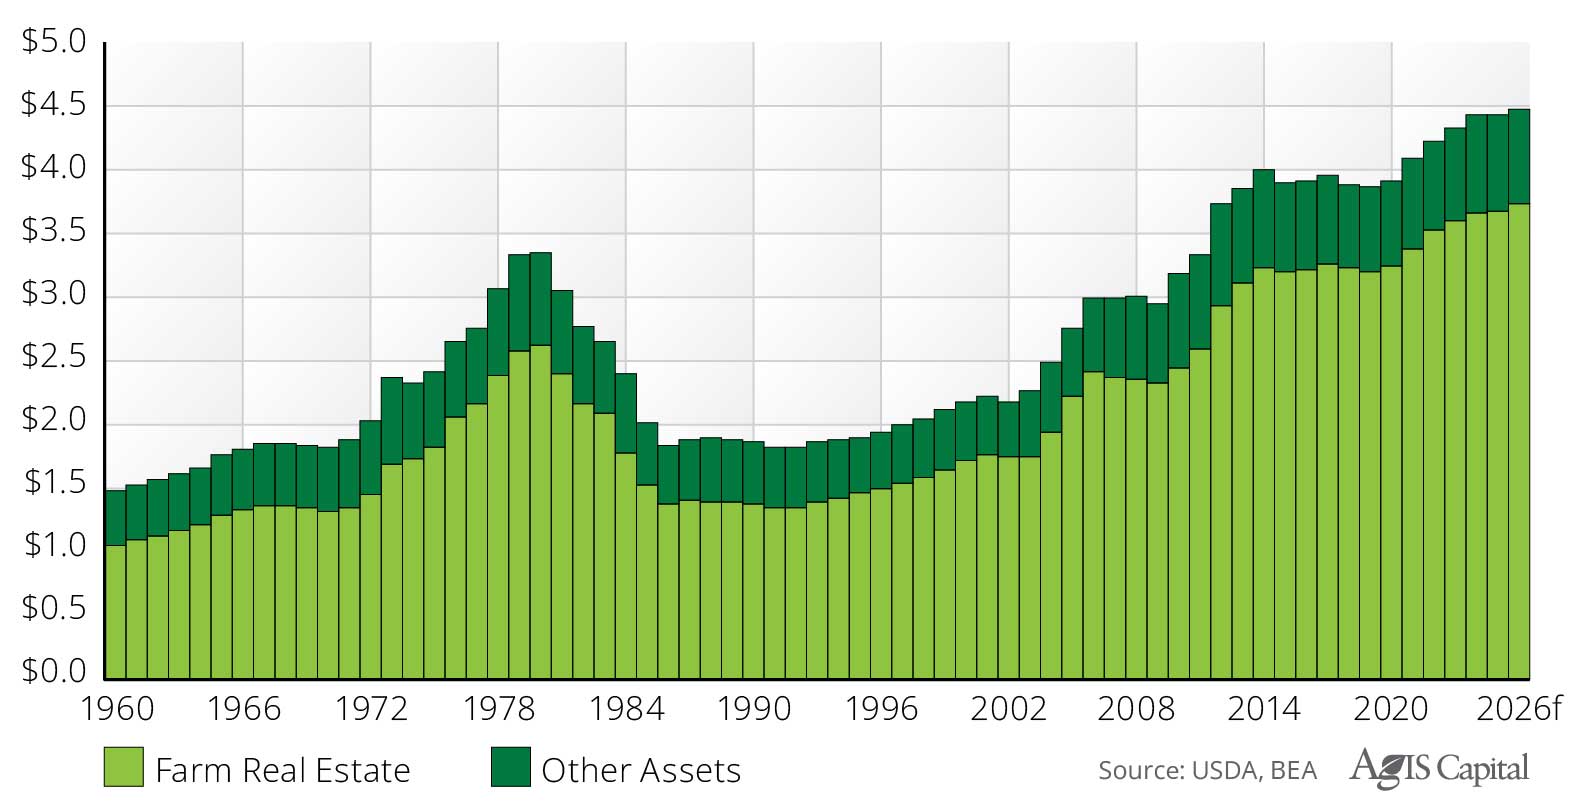
Figure 7) U.S. Farm Sector Debt Ratios: 1960 to 2026f
The Farmland Index
The NCREIF TFI returned to positive territory, though barely, in 2025. After recording its first negative annual total return of -1.0 percent in 2024, the index posted a total return of 0.2 percent for the year ending December 31, 2025 (see Row 1, Column (g) in Figure 8). The income return stood at 3.1 percent, while the capital return was -2.8 percent. The TFI consisted of 1,035 assets, a net increase of 12 properties. The value of the TFI totaled $16.2bb, with an average property value of $15.7 million (mm).
Figure 8) NCREIF Farmland Returns: one- and five-year, annualized, million dollars
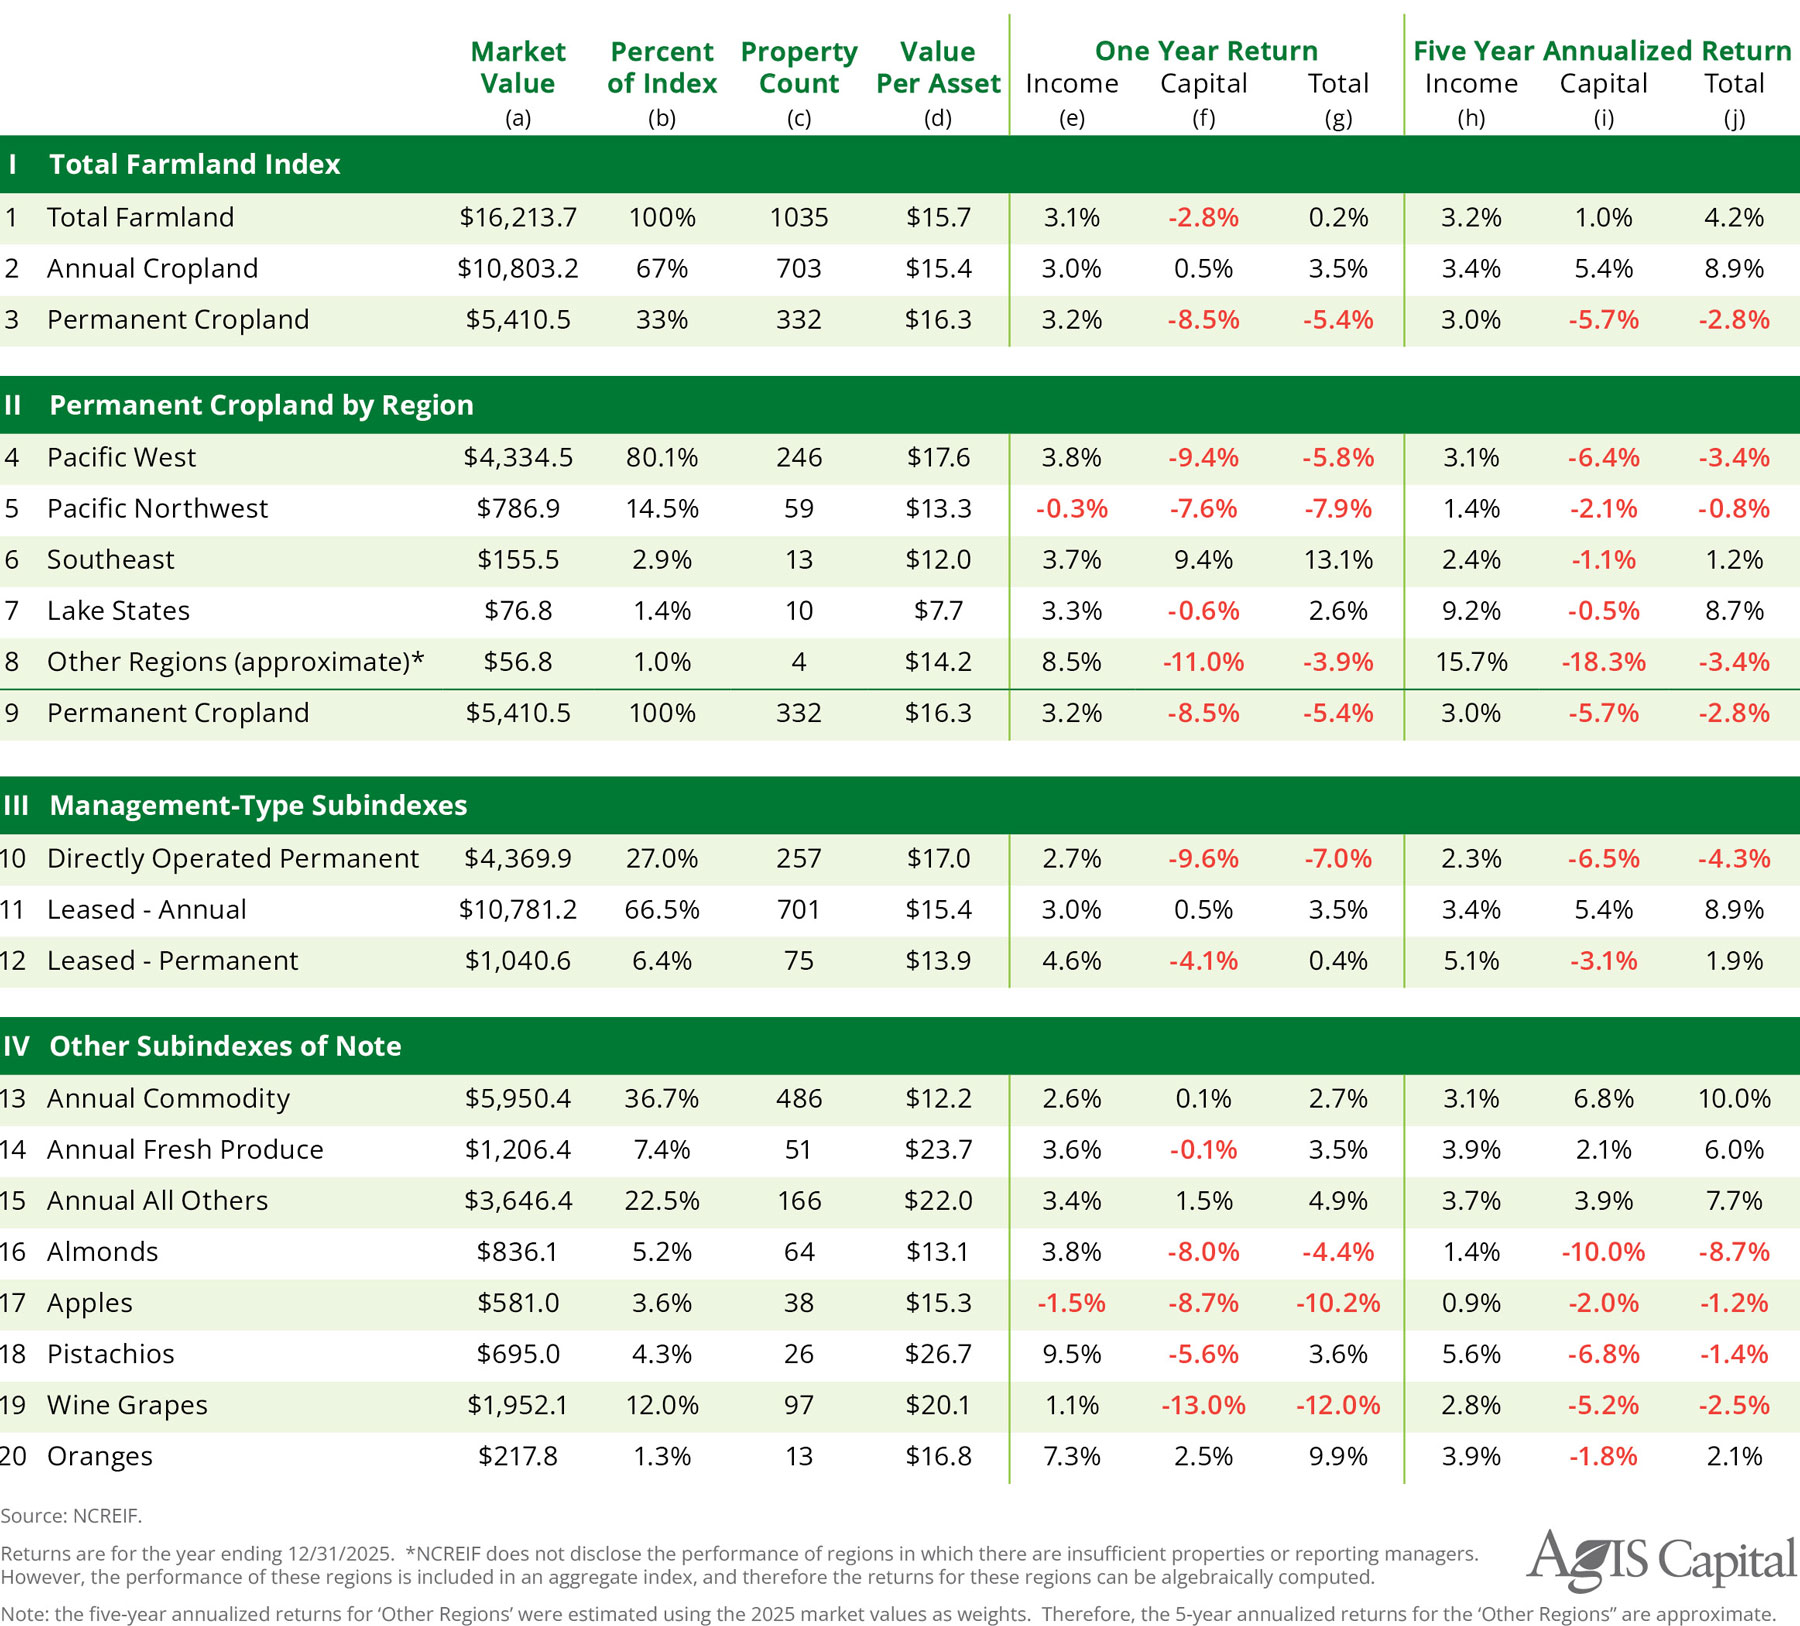
The Annual Cropland Index included 703 leased assets, an increase of 50 from the previous year. The Index’s market value stood at $10.8bb, with the average value at $15.4mm per property. Annual crops delivered a total return of 3.5 percent in 2025, comprising income returns of 3.0 percent and capital returns of 0.5 percent. The total return and income return were the lowest annual returns on record since NCREIF began reporting in 1991, while the capital return was the second-lowest. While the income and total returns underwhelmed relative to previous performance, it is still a remarkable feat to have 35 years of annual return data that have yet to post a negative income, capital, or total return. These returns reflect the U.S.’s federal agricultural policy, which materially truncates the downside risk borne by annual-crop producers through subsidized revenue insurance, commodity and disaster payments, price-support programs and government-supported credit. Because NCREIF Annual Cropland is leased to tenant farmers, these benefits are transmitted to institutional landowners through lower tenant-default risk, more stable rents and the capitalization of expected support into farmland values.

The NCREIF Permanent Cropland Index included 332 properties, a net reduction of 38. The Index’s market value was $5.4bb, with an average value of $16.3mm. The Permanent Cropland Index recorded a total return of –5.4 percent, with income returns of 3.2 percent and capital returns of -8.5 percent. The total and capital returns were the second lowest since the Index began in 1991, above only the 2024 annual returns, and the negative total return marks the third consecutive year.
Performance varied considerably across crop types in 2025. Oranges posted the highest total return at 9.9 percent, followed by Lake States annual cropland at 9.1 percent. Wine grapes and apples were at the other end of the continuum, returning -12.0 percent and -10.2 percent, respectively, leaving nearly 2,200 basis points between the top and bottom of the Index. The 12.0 percent decline in wine grapes was the worst annual return in the Index’s 29-year history, while cumulative capital losses since 2018 have reached roughly 21.5 percent. Pistachios finished the year with a total return of 3.6 percent, as a 9.5 percent income return more than offset a 5.6 percent capital loss. Pistachios posted the highest income return of any sub-index in 2025, more than three times the farmland average.
Figure 9) Annual Cropland Returns and the 10-Year Constant Maturity Rate: 1991 to 2025

Annual cropland in the NCREIF Index is generally leased to tenant farmers, making the rent those farmers can support central to land values. Investors are ultimately buying a stream of future rental income and pricing it against the returns available elsewhere. Since 2021, annual cropland values have continued to rise even as crop prices softened. Income returns have therefore compressed; at the same time, Treasury yields have moved higher. Figure 9) shows the consequence. In 2025, the NCREIF Annual Cropland income return fell below the average yield on the 10-year constant maturity Treasury for the third consecutive year. That did not occur at any point from 2008 through 2022. The gap widened to 130 basis points in 2025, the largest on record and slightly above the 119-basis-point spread in 2024. If lower commodity prices persist, tighter tenant margins will leave less room for higher cash rents, making further appreciation in annual cropland increasingly difficult to sustain.
Our Thoughts
The U.S. almond and pistachio industries have faced substantial headwinds for much of the past decade. One of the most persistent headwinds emerged in 2016, when the dollar strengthened considerably and has since remained elevated. Because foreign buyers account for most U.S. almond and pistachio demand, a stronger dollar reduces their purchasing power and puts downward pressure on prices.
Trade policy delivered the second blow. Beginning in 2018, China, Turkey, and India imposed retaliatory tariffs on U.S. tree nuts to varying degrees. China was the largest of these markets, and the tariff burden there became most severe. Duties on U.S. almonds increased from the 10 percent most-favored-nation rate to more than 50 percent by late 2019. In-shell pistachios, which had previously faced a five percent duty, were also swept into the retaliatory tariff increases. Successive rounds of escalation in 2025 left provisional Chinese duties on U.S. tree nuts at roughly 25 to 60 percent, depending on the product and its degree of processing. These rates are several multiples higher than those paid by competing origins, prompting U.S. exporters to diversify their shipping channels and reduce their dependence on direct sales to China. COVID and the subsequent shipping crisis then made it harder for California tree-nut exporters to get nuts out of the state, with canceled bookings, rolled vessels, port delays, higher fees, and product backing up at the handler level. All of this occurred while the almond and pistachio crops were growing larger on average, as trees planted during the previous decade matured and began to bear.
The decade of adversity, however, significantly strengthened the resilience and flexibility of California’s tree-nut export supply chain. Consequently, when the conflict with Iran erupted in late February 2026 and shipping through the Strait of Hormuz effectively ceased, the U.S. almond and pistachio sectors were far better equipped to reroute shipments, meet substitute demand, and manage regional market disruptions than they would have been ten years earlier. Two years of shipment data from the Almond Board of California (ABC) Position Reports and the Administrative Committee for Pistachios Shipment Reports illustrate how quickly that rerouting occurred.

Almonds: The Trade Rerouted in Real Time
According to the July 2026 Position Report, shipments during the full 2025/26 marketing year totaled 2,629.6mm pounds (lbs.), down 0.6 percent from the prior year. The supply backdrop makes that figure more impressive than it first appears. Total marketable supply was 3.124 billion lbs., about 1.2 percent below the prior year’s 3.161bb lbs., while almond prices remained well above year-ago levels. Prices were supported by tight in-shell supplies, strong demand for prompt delivery, and USDA’s 2026 crop estimate of 2.7bb lbs. Moving the same volume at meaningfully higher prices points to firm demand rather than excess supply being cleared through discounts. In our view, this is the strongest demand signal the almond industry has produced since 2020.
The composition of shipments changed dramatically. Exports finished the year up 3.0 percent and accounted for 77 percent of total shipments, above both the ABC forecast of 75 percent and the preceding three-year average of 73 percent. By contrast, domestic shipments fell 11.3 percent. The shift within the export program was even more striking. The United Arab Emirates (UAE), long the Middle East’s dominant transshipment hub through the Port of Jebel Ali, saw monthly shipments fall 98 percent in March 2026 after the closure of the Strait of Hormuz stranded cargo and forced some shipments to be resold. Turkey appears to have absorbed much of this displaced trade. Turkey’s March shipments roughly doubled from the year before, and its full-year shipments increased 45 percent to 156.6 mm lbs. UAE shipments fell 24 percent to 116.9 mm lbs. Turkey therefore finished the season ahead of the UAE as the region’s leading destination and emerged as a major trading hub. Total shipments to the Middle East rose 3 percent, indicating that regional demand remained resilient despite the war.
The UAE saw monthly almond shipments fall 98 percent in March 2026 after the closure of the Strait of Hormuz. Turkey appears to have absorbed much of this displaced trade, as its full-year shipments increased 45 percent.
China is the more complicated story. Direct shipments to China and Hong Kong finished down 34.5 percent under the tariff schedule described above. Nearly all the decline was in in-shell almonds, whose shipments fell 94 percent, while direct shelled shipments increased 8 percent. Over the same period, shipments to Southeast Asia rose 26 percent, led by Vietnam, which was up 30 percent. Combined shipments to China, Hong Kong, and Vietnam were flat, falling just 0.4 percent.
These figures suggest that rerouting accounts for part of the decline in direct shipments to China, but they do not show that every pound lost in China moved through Vietnam. Vietnam has developed a substantial import, processing, and re-export industry for U.S. tree nuts. Almonds brought into Vietnam for processing and re-export can be exempt from import duties if they meet the country’s customs requirements. USDA has also reported that significant volumes of U.S. almonds continue to move through Southeast Asia for processing and later shipment to China. Some Chinese demand is therefore still being met with California almonds via Vietnam. This longer route adds costs and allows intermediaries to retain a larger share of the margin.
Rerouting does not fully explain the decline. USDA reports that growth in China’s almond market has slowed and that Australia has replaced the United States as China’s leading supplier. Australian almonds benefit from duty-free access to China and shorter shipping distances. ACR therefore interprets the decline in direct shipments to China as a combination of rerouting, weaker demand, and increased competition from Australia. Europe, up 4.7 percent for the season, also supported exports. India finished the 2025/26 marketing year down 10.5 percent for two reasons. Limited supplies of in-shell almonds from the 2024 crop reduced shipments at the beginning of the marketing year. At the end of the marketing year, Indian buyers were able to delay some festival purchases because Diwali falls on November 8 this year, nearly three weeks later than in 2025. Those buyers can use almonds from the 2026 harvest, which will ship in August, September, and October and be counted in the 2026/27 marketing year rather than 2025/26. With inventories in India already low, demand for new-crop in-shell almonds is strengthening.
The market has rewarded this flexibility. Unshipped commitments finished 14.3 percent above the prior year, while sales from the 2026 crop totaled 302.5 mm lbs., compared with 284.8 mm lbs. at the same time last year. The July report showed 494.2 mm lbs. of remaining inventory before final loss and inedible adjustments, down 4.0 percent from a year earlier. Final carryout is likely to be lower after those adjustments. Prices, meanwhile, have reached their highest level in a decade. With the 2026 crop estimated at or below 2.7 bb lbs., roughly in line with the preceding five-crop average of about 2.67 bb lbs., and Land IQ reporting the first year-over-year decline in bearing acreage since 1995, the almond supply-demand balance is the tightest it has been in several years.

Pistachios: A Record On-Year Crop Meets a Supply Vacuum
The 2025/26 pistachio marketing season was an on-year in the crop’s natural alternate-bearing cycle, resulting in a record harvest. Crop receipts totaled approximately 1.59bb lbs. on an in-shell equivalent basis, up roughly 70 percent from the 2024/25 off-year crop of 934mm lbs. and up about six percent from the previous on-year crop in 2023/24. After shrinkage and handler-reported adjustments, adjusted inventory totaled approximately 1.51bb lbs. on the same basis, leaving the industry with more product to sell than in any prior season. A supply increase of that size would normally put substantial downward pressure on prices.
That did not happen. The industry moved a record crop even as prices increased. In March 2026, Expana’s benchmark price for bulk, U.S.-origin in-shell pistachios reached approximately $4.57 per pound, its highest level since May 2018. Through July, cumulative shipments totaled 1.215bb lbs. on an in-shell equivalent basis, up 17.5 percent from the prior year and only 2.5 percent below the record 2023/24 pace. Export shipments increased 24.0 percent to 892.6mm lbs., while domestic shipments rose 2.8 percent to 322.6mm lbs. Estimated marketable inventory stood at 298.7mm lbs. on an in-shell equivalent basis on July 31. Depending on August shipments, carryover into 2026/27 could finish modestly above, but still near, the industry’s roughly 200mm-lb. expectation. That will leave the market with relatively little supply heading into a 2026 off-year crop, which is now generally estimated at only 600mm to 800mm lbs., further reduced by heat stress during bloom. Record shipments, higher prices, and limited carryout in the same season are difficult to reconcile with a weak demand environment.
As with almonds, the more important story is where the product went. Through July, shipments to mainland China fell from 152.9mm lbs. in 2024/25 to 31.7mm lbs. this season, a decline of 79.3 percent. The drop reflects the retaliatory tariff structure discussed above. The University of California’s Giannini Foundation estimates that these tariffs reduced California pistachio export value by roughly $478mm between 2024 and 2025, the largest loss for any single commodity in its study. The volume, however, did not disappear. It moved through other trade channels.
Much of Chinese demand for U.S. pistachios appears intact, but the tariff wall has redirected trade through processing hubs and raised the landed cost paid by Chinese buyers.
Through July, U.S. pistachio shipments to Vietnam increased 155 percent to 126.5mm lbs., while shipments to Hong Kong rose 651 percent to 60.7mm lbs. Combined shipments to mainland China, Hong Kong, and Vietnam totaled 218.9mm lbs., approximately four percent more than during the same period last year. Industry reports indicate that more than 60 percent of the pistachios imported into Vietnam are processed there, with roughly 70 percent of that processed volume then re-exported to China. In January 2026 alone, Vietnam exported $140mm of pistachios, up more than 400 percent from the prior year, despite producing no pistachios domestically. The evidence is even stronger for almonds. Much of Chinese demand for U.S. pistachios appears intact, but the tariff wall has redirected trade through processing hubs and raised the landed cost paid by Chinese buyers. Through July, shipments to Turkey reached 65.7mm lbs., up 146 percent, reflecting both Turkey’s crop shortfall and its role as an alternative distribution route during disruptions near the Strait of Hormuz.
The conflict was a major driver of this shift in trade flows. Iran, historically the world’s second-largest pistachio producer, ships most of its exports through Bandar Abbas, near the Strait of Hormuz. With the Strait largely closed and Iranian ports blockaded, Iranian pistachio exports totaled 286.6mm lbs. through July, down 30 percent from the prior year. Shipments during the marketing month ending July 22 totaled only 11.0mm lbs., 58 percent below the same month last year.
The Iran Pistachio Association estimated that 196.2mm lbs. remained in inventory as of July 22. It projects inventory will decline to about 165.4mm lbs. by the end of the marketing year, a record carryover for the Iranian industry. The Far East accounted for only seven percent of Iran’s season-to-date exports, while the Commonwealth of Independent States, the Indian subcontinent, Turkey, and the UAE together accounted for 76 percent.
With California’s two major competing origins still constrained, California pistachio shipments to the Middle East and Africa reached 173.8mm lbs. through July, up 85.6 percent from the prior year.
Turkey faced serious production problems. Its 2025 crop was already an off-year, and spring frost and drought in the southeastern growing region reduced production by nearly 70 percent to approximately 264.6mm lbs. Local reports indicate that some frost-damaged orchards may take as long as three years to return to full production. Turkey’s production is expected to recover to approximately 343.9mm lbs. in 2026/27, but it would remain far below the 2024/25 crop. With California’s two major competing origins still constrained, California pistachio shipments to the Middle East and Africa reached 173.8mm lbs. through July, up 85.6 percent from the prior year.
The June 17 14-point memorandum of understanding between the United States and Iran briefly created a caveat to this outlook, but that framework has since collapsed. On July 7, the Office of Foreign Assets Control revoked General License X, which had temporarily authorized petroleum-related transactions, and replaced it with a wind-down license that expired on July 17. The prohibition on U.S. imports of Iranian-origin goods therefore remains in force, while the United States has restored its naval blockade and, on August 24, imposed additional sanctions targeting Iranian shipping, financial, and oil-revenue networks. Even if a later agreement lifts those restrictions, Iranian pistachios would remain subject to the antidumping duty order in place since 1986. More importantly, renewed Iranian access to banking, shipping, and insurance would have a greater effect on exports to India, China, Turkey, and the European Union than on the U.S. market. ACR will continue to monitor OFAC licensing activity, but we do not expect Iranian pistachios to return to U.S. trade channels in meaningful volumes. Any broader normalization of Iranian exports now depends on a new ceasefire and sanctions agreement.
Europe Opens the Door Wider
 While China raised its trade barriers, Europe moved in the opposite direction. On June 25, 2026, the EU adopted Regulation (EU) 2026/1455, establishing a zero-duty tariff-rate quota of approximately 1.102 billion pounds for U.S. tree nuts. The quota covers almonds, pistachios, walnuts, pecans, and other tree nuts, both in-shell and shelled, as well as prepared products. It operates in consecutive 12-month periods beginning July 1, 2026, and the regulation remains in effect through December 31, 2029.
The quota is large enough to cover nearly all existing trade. EU imports of the principal covered U.S. nuts totaled approximately 1.142 billion pounds in 2025, just 39.3 million pounds above the quota. The immediate savings are modest because the previous tariffs were relatively low, but the reduction in policy risk matters more. The EU scheduled additional duties of 25 percent on U.S. almonds and 30 percent on U.S. pistachios in 2025 but suspended them before they took effect. On July 30, 2026, the European Commission extended that suspension from August 7, with no end date. The measures remain available for reactivation but are not currently applied, giving qualifying U.S. shipments within the quota broad duty-free access.
The timing is favorable. Europe remains structurally short on tree nuts, and Spain’s almond crop is only a fraction of California’s. Almond shipments to Europe finished the 2025/26 season up 4.7 percent, while U.S. pistachio shipments to Europe through July were up 19.5 percent. With U.S. suppliers already dominant in both markets, the quota is more likely to reinforce existing trade than to redirect it immediately. It provides room for further growth and a more dependable outlet after disruptions in the Middle East exposed the risks of relying heavily on individual export routes.
The Super El Niño: Water on the Way, Heat in the System
Layered atop the geopolitical disruption is a major climate event already underway. In its August 13, 2026, ENSO Diagnostic Discussion, NOAA’s Climate Prediction Center reported that El Niño continues to strengthen and has a greater than 90 percent chance of becoming a very strong El Niño this fall and winter. NOAA also estimates a 69 percent chance that it will be stronger from October through December than any El Niño recorded since 1950. El Niño is expected to last through spring 2027. A strong El Niño does not guarantee a wet winter in California, especially in the northern part of the state, but it makes one more likely. The Climate Prediction Center’s latest forecast shows a greater chance of above-average precipitation across Southern California and much of the southern United States from late 2026 through spring 2027.
For California almond and pistachio growers, the implications cut both ways. On the favorable side, a wet winter could rebuild reservoirs and begin restoring the Sierra Nevada mountain range snowpack after the statewide April 1 measurement fell to just 18 percent of average, the second-lowest reading on record. Record heat and a dry March caused much of the season’s limited snowpack to melt weeks ahead of schedule. A wet winter would also create a valuable opportunity for groundwater recharge for growers and water districts with the rights, conveyance, and infrastructure needed to capture high flows. Under SGMA, that benefit extends beyond a single season because successful recharge can slow groundwater decline and improve the long-term water balance of stressed basins.
The risk is that more precipitation does not necessarily mean more usable water or better yields. El Niño is arriving against a warmer climate baseline, increasing the likelihood that more precipitation will fall as rain rather than snow. Warm, wet winters can also reduce chill accumulation, accelerate and compress bloom, limit bee flight hours, and increase fungal disease pressure. Those risks were evident during the 2026 bloom, when heat stress and poor nut set led private estimators to project a pistachio crop as low as half the record 2025 harvest and an almond crop below the five-year average. The same winter that improves California’s water position could therefore create production problems if storms are too warm or arrive at the wrong point in the bloom cycle.
The Climate Prediction Center’s current long-lead outlook favors above-normal precipitation across Southern California and much of the southern tier of the United States from late 2026 into spring 2027.
The outlook for competing production regions leans more clearly in California’s favor. Australia’s Bureau of Meteorology reports that a strong El Niño is well established and expects below-average rainfall across parts of southern and eastern Australia from September through November, along with above-average daytime temperatures south of the tropics. Australia, which competes with Spain as the second-largest almond producer and ranks second among almond exporters, is heavily dependent on irrigation in the Murray-Darling Basin. Growers have already faced weather-related constraints on in-shell availability, and disruptions in the Strait of Hormuz have increased exposure to higher fuel and fertilizer costs. In Iran, Turkey, and the Levant, continued dryness would place further pressure on already-limited water supplies. Iran’s 2025 pistachio crop was reduced by drought even before the war, while Turkey is still dealing with the effects of frost and drought in its southeastern production region.
India presents a different type of risk. The India Meteorological Department’s updated seasonal forecast projects 2026 southwest monsoon rainfall at 90 percent of the long-period average, with below-normal rainfall expected across much of the country and the principal rain-fed agricultural region. A weak monsoon could weigh on rural incomes and food demand in California almonds’ largest export market. Even so, India’s strong purchasing through the spring suggests that underlying consumption remains firm, making the monsoon a risk to watch rather than evidence of a demand reversal.
A very strong El Niño would likely be a net positive for California tree nuts, although the effects would not be uniform. A wetter winter could improve water supplies and create a meaningful opportunity for groundwater recharge. At the same time, production risks could increase in Australia, while dry conditions in Iran and Turkey may persist. California would face its own risks, especially if storms are too warm to build the snowpack or arrive at the wrong time for chill and bloom. Even so, improved water availability would likely leave California in a better position than its major competitors. Much will depend on the temperature and timing of the storms and how much of that water can actually be captured.
SGMA Will Separate the Winners from the Losers
The market value of almond and pistachio orchards has averaged 35.8 percent of the NCREIF Permanent Cropland Index since the Index’s inception in 1991. Their contribution to index returns has been far larger than their share of value. Pistachios have delivered the strongest long-run returns of any permanent crop, generating a 15.3 percent annualized total return from 1992 through 2025 and a 13.3 percent annualized income return. Almonds and pistachios together have also outperformed the broader Permanent Cropland Index by roughly 240 basis points per year since 1991. The importance of these crops to the Index is clear in the numbers. Without almonds and pistachios, the Permanent Cropland Index would have returned 8.1 percent annually from 1991 through 2025 rather than 9.4 percent. That 130-basis-point difference remains even after several years of weak performance beginning in 2020. Annualized capital returns for almonds and pistachios between 2020 and 2025 were -8.9 percent and -5.7 percent, respectively, far below those of other permanent crops. In part, this reflects the widespread planting of almonds and pistachios throughout the San Joaquin Valley, including in areas with inadequate water rights.
That last clause is the crux of the investment case. The past year has demonstrated that demand for California almonds and pistachios is deep, global, and flexible. A record pistachio crop was absorbed at the highest prices in eight years. The almond trade rerouted around a war in a matter of weeks and moved essentially the same volume as the prior year at higher prices. Even China’s tariff wall proved porous, with products reaching Chinese consumers through Vietnamese and Hong Kong processing channels. What ails these industries is not demand. It is a decade of over-supply, much of it planted on ground with little or no surface water. SGMA is the mechanism that will resolve that imbalance. ACR believes that a significant number of almond and pistachio plantings will need to be removed over the next five years as groundwater sustainability agencies implement pumping allocations and fees in critically overdrafted basins. Growers dependent on overdrafted groundwater will be economically compelled and, in some instances, legislatively required to reduce their acreage.
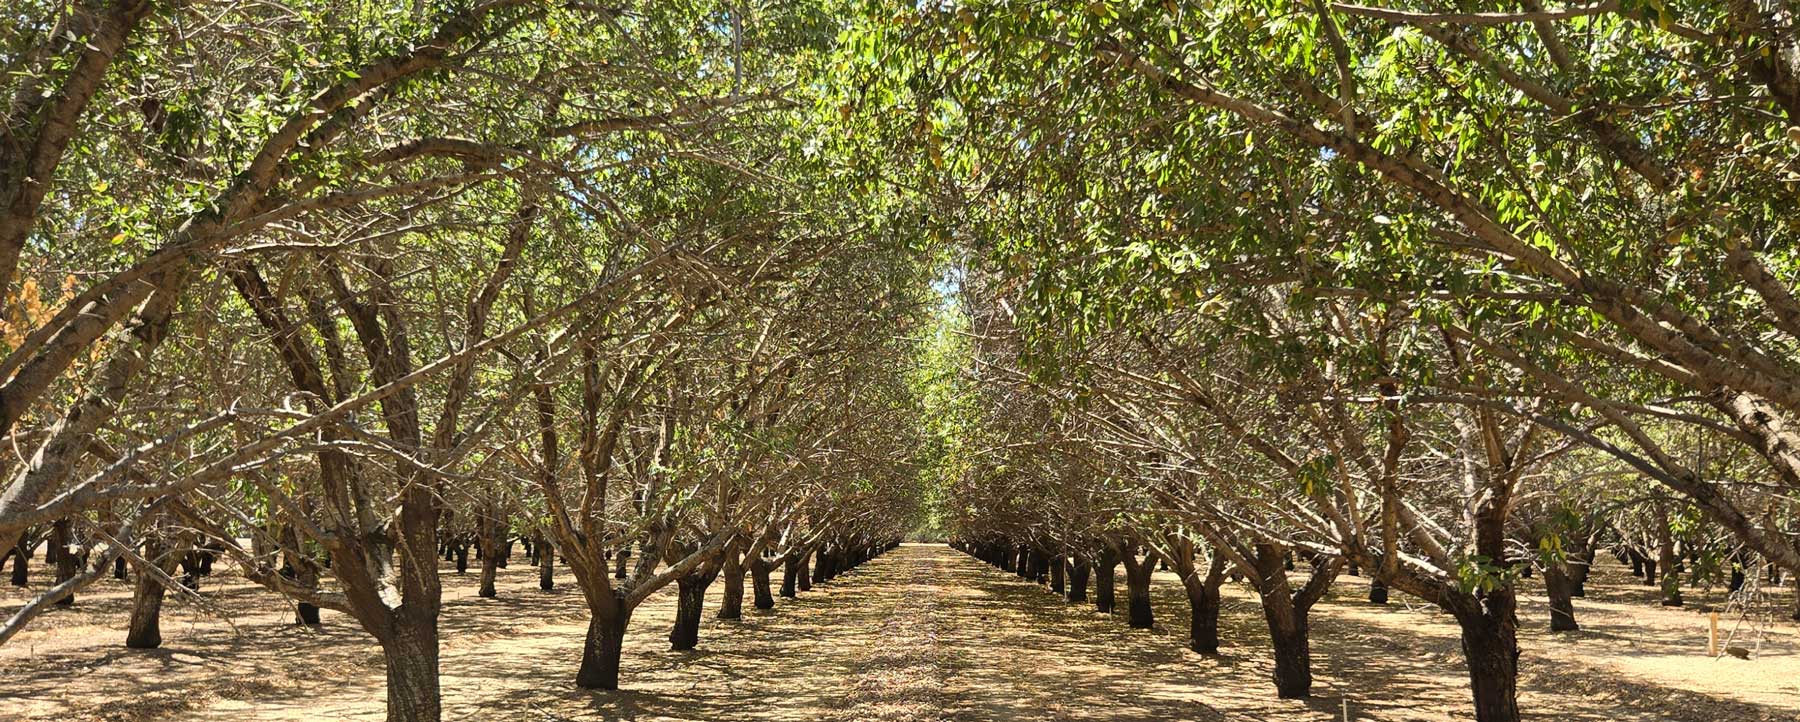
The California almond and pistachio industries appear to be on solid footing, provided they hold strong surface water rights.
For owners of orchards with reliable surface water rights, the outlook is markedly different. They enter this transition with the lowest incremental water costs in the industry and exposure to the price appreciation that will accompany the removal of acreage with poor water resources. The 2025/26 season offered a preview: constrained competing supply, whether from war, drought, or tariffs, translated quickly into firmer prices and cleaner inventories. As SGMA removes acreage with marginal water rights permanently rather than episodically, ACR expects average almond and pistachio production to decline, prices and income to strengthen, and capital values to recover for the acreage that remains standing. In short, the California almond and pistachio industries appear to be on solid footing, provided they hold strong surface water rights. SGMA will force the losers to exit the market; the winners will inherit it.
Conclusion
The NCREIF Permanent Cropland Index recorded a third consecutive negative total return in 2025, with almond and pistachio orchards again weighing on capital values. That recent performance stands in sharp contrast to the crops’ long-run record. Almonds and pistachios have accounted for 35.8 percent of the value of the Permanent Cropland Index since 1991, yet their contribution to returns has been far greater. Without them, the index’s annualized return would have been roughly 130 basis points lower. The question for investors is whether the conditions that drove the recent downturn are likely to persist.
ACR believes they are beginning to change for the positive. The 2025/26 marketing year provided strong evidence that demand for California almonds and pistachios remains intact. California sold a record pistachio crop at the highest prices in eight years and is expected to enter the next marketing year with limited carryover. Almond shipments stayed near prior-year levels despite higher prices. When the Strait of Hormuz closed, exporters rerouted product through other markets within weeks. Direct trade with China has fallen sharply, but a large share of product is now moving through Vietnam and Hong Kong. Europe has also removed a major tariff risk through 2029. These are not industries suffering from a lack of demand.
Almond and pistachio production increased rapidly just as several of the industries’ largest export markets became harder to serve. The dollar strengthened, eroding the purchasing power of foreign buyers, and retaliatory tariffs made U.S. nuts more expensive in several key markets. COVID made matters worse. Exporters struggled to secure containers and vessel space, bookings were canceled or delayed, ports became congested, and product accumulated at handlers rather than moving into foreign markets. Without those events, the market might have absorbed much of the additional production. Instead, larger crops arrived while foreign buyers had less purchasing power, tariffs were higher, and exporters were struggling to move product out of California. Prices and grower income declined, followed by orchard values.
The next acreage adjustment will be different. Much of the almond and pistachio acreage added over the past decade was planted in areas of the San Joaquin Valley with little or no reliable surface water. SGMA is now increasing costs and limiting the amount of groundwater available to many of those orchards. ACR expects a meaningful amount of almond and pistachio acreage to be removed over the next several years as pumping allocations and fees make continued production uneconomic. In some areas, growers will have little choice. Unlike the shipping delays, tariffs, or temporary production losses discussed in this report, acreage removed because of an inadequate long-term water supply will not return.
For orchards with reliable surface water, ACR believes the current market offers one of the most compelling investment opportunities in years. Capital values have already reflected several years of weak returns, while the reduction in productive acreage is only beginning. As orchards with inadequate water are removed, less production will remain to meet demand that has proven remarkably resilient. ACR expects that adjustment to support almond and pistachio prices, improve orchard income, and ultimately increase the value of properties with secure water supplies. The opportunity is not to buy California tree nuts indiscriminately. It is to acquire the right orchards before SGMA removes a meaningful portion of their competition. ACR believes that opportunity exists today.
IN THIS ISSUE
AUTHOR

SHARE

Contact
For more information on the investment services offered by AgIS Capital please contact us today.
This document and the information contained herein should not be reproduced, communicated, or shared with any other party, either in whole or in part, without the express written consent of AgIS Capital.
The views expressed herein represent the opinion of AgIS Capital which is subject to change and are not intended as a forecast or guarantee of future results. Stated information is derived from proprietary and non-proprietary sources which have not been independently verified for accuracy or completeness. While AgIS Capital believes the information to be accurate and reliable, we do not claim or have responsibility for its completeness, accuracy, or reliability. Statements of future expectations, estimates, projections, and other forward-looking statements are based on available information and management’s view as of the time of these statements. Accordingly, such statements are inherently speculative as they are based on assumptions that may involve known and unknown risks and uncertainties. Therefore, actual results, performance, or events may differ materially from those expressed or implied in such statements.
Past performance of various investment strategies, sectors, vehicles, and indices are not indicative of future results. There is no guarantee that the investment objective will be attained. Results may vary. There is no guarantee that risk can be managed successfully. Diversification does not assure a profit, nor does it protect against loss of principal.
Projected performance figures are based on certain assumptions, including but not limited to income growth, commodity yields and prices, expense growth, asset depreciation, and land value appreciation. They should not be viewed as guarantees of future returns, nor should they be interpreted as future profitability. Potential for profit as well as loss exists. The impact of future economic events, market changes, and weather conditions may adversely affect the performance of any investment. Performance objectives and projections are based on information available to us at this time and are not meant to be interpreted as guarantees or commitments to future results. The economic outlook is developed by AgIS Capital’s professionals based on its knowledge of agricultural, commodity and economic trends and drivers.
Prices of crops and commodities can be expected to fluctuate. The demand for one or more commodities is affected by numerous factors, including weather conditions, quality of commodity, supply and demand for such commodity in the U.S. and in one or more international markets, relative strength of local currency, government farm programs and policies, demand from the biofuels industry, price volatility as a result of increased participation by non-commercial market participants in commodity markets and changes in global demand resulting from population growth and changes in standards of living. In addition, an increase in raw material prices, such as fertilizer, may have an adverse effect on the operations of a farmland investment.
Agricultural investments are subject to damage from fire, flood, frost, drought, insects, disease, storms and/or poor pollination. Productivity may be lost as a result of adverse weather conditions such as drought or excessive heat or cold. Consistent with local agricultural industry practice, AgIS Capital may not be required to carry crop insurance, and AgIS Capital will determine if insurance on directly operated crops is warranted. Access to Irrigation and Water Rights Water is of primary importance to agricultural production. A lack of rain, increases in water price and the loss or reduction in access to irrigation water can have an adverse effect on the financial operations of agricultural investments. The increasing shortage of water in many irrigated growing regions in the U.S. and other growing regions around the globe, often as a result of new water restrictions imposed by laws or regulations, may lead to decreased productivity growth and, in some cases, cause crop yields to decline.
A material change to any of these drivers could change our outlook as it is based on certain assumptions that may or may not become true. The performance advertised does not represent actual results but was achieved by designing a hypothetical investment with accumulated knowledge of past performance.
Performance figures are before the deduction of investment management fees, nominal and pre-tax unless stated otherwise.