

VOLUME 9 • SECOND QUARTER, 2025
Into the Abyss
The U.S. agricultural sector’s net farm income in 2025 is projected to reach its third-highest level since 1960, although direct government payments are also anticipated to be at the second-highest level ever. The value of the U.S. dollar—despite weakening in recent weeks—remains historically strong, and net agriculture exports are expected to hit a record low. The combination of slightly elevated inflation and the economic turmoil caused by the new administration’s threat and implementation of tariffs and other policy objectives has made the Federal Reserve Bank cautious, and the policy rate appears to be stuck until something changes.
Our annual State of the Market report offers an overview of the trends and forces influencing farmland returns. This edition explores how these trends impact both current and future farmland investment performance. We also examine the National Council of Real Estate Investment Fiduciaries (NCREIF) Farmland Index and provide context and commentary on the asset class’s recent and projected performance, taking into account emerging macroeconomic trends. Lastly, we analyze the performance of permanent crops over various timeframes and add further context to recent returns.
Trends
On February 6, 2025, before “Liberation Day”, the Economic Research Service (ERS) of the United States Department of Agriculture (USDA) released its forecast for farm sector income in 2025.
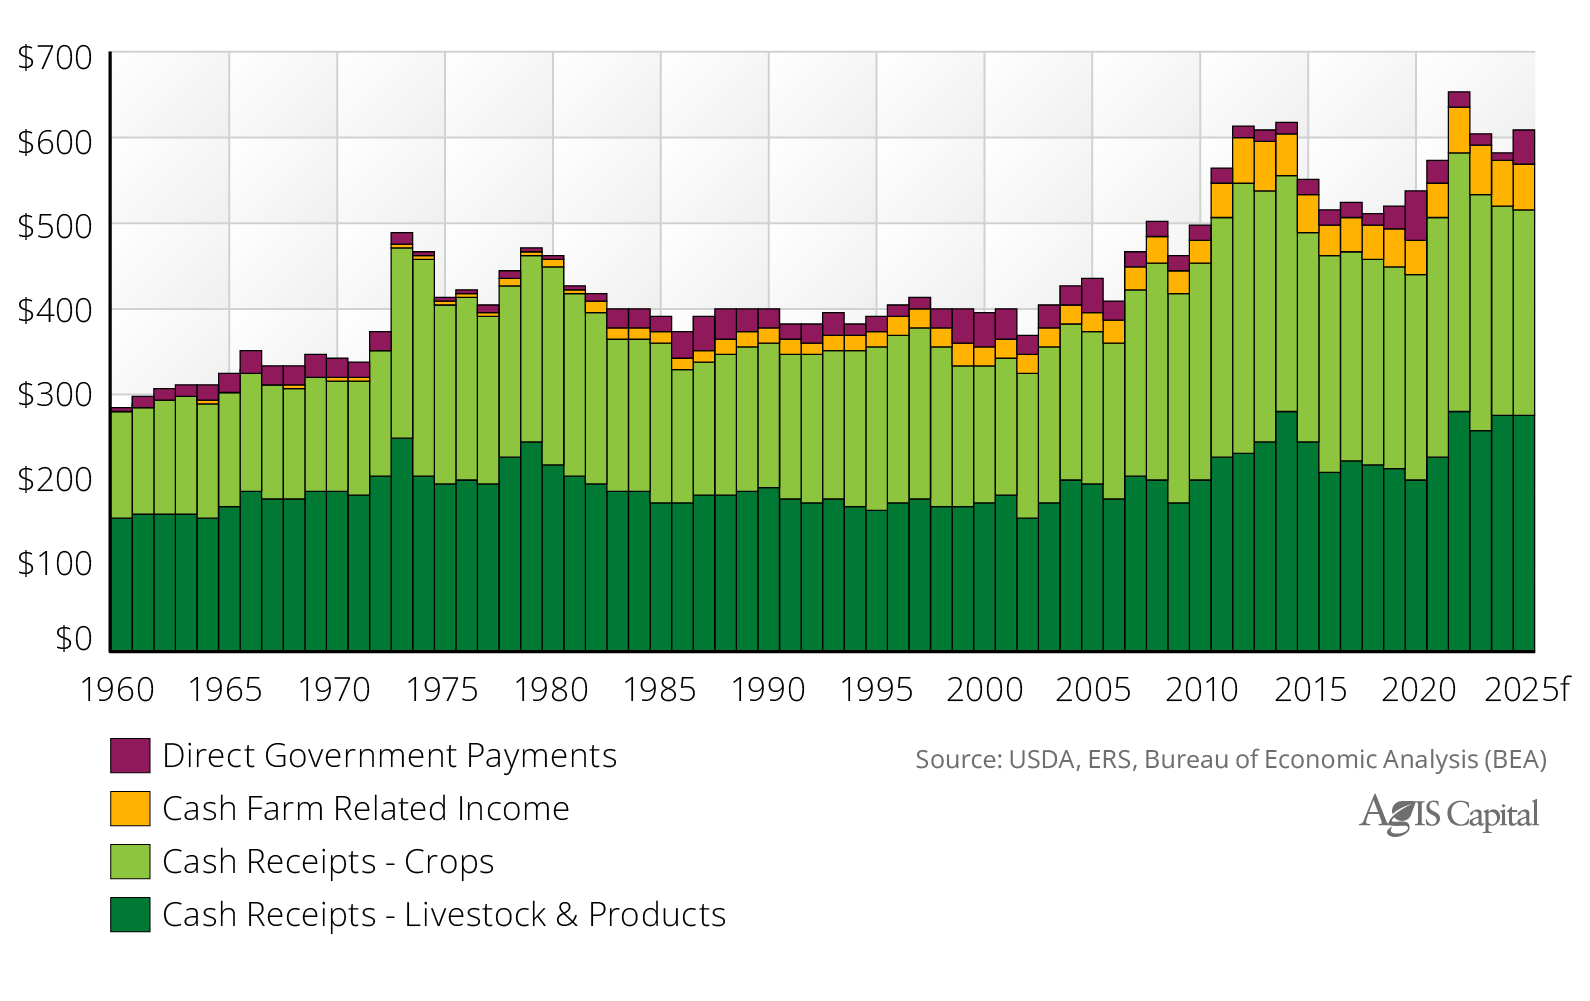
In real terms, gross cash income is projected to rise 4.6 percent, reaching $609.4 billion (bb) in 2025, although this represents a 6.6 percent decline from the record $652.3bb achieved in 2022.
The rise in gross cash income is mainly attributed to the $42.5bb in direct government payments, marking the second-highest amount recorded, only surpassed by the $54.6bb in 2020. The $33.0bb increase in direct government payments and the $1.6bb rise in cash receipts for livestock and products more than offset the $7.5bb drop in cash receipts from crops and the $0.5bb reduction in farm-related income (see Figure 1).
Figure 1) Real Gross Cash Income Components: 1960 to 2025f, billions, 2025 dollars
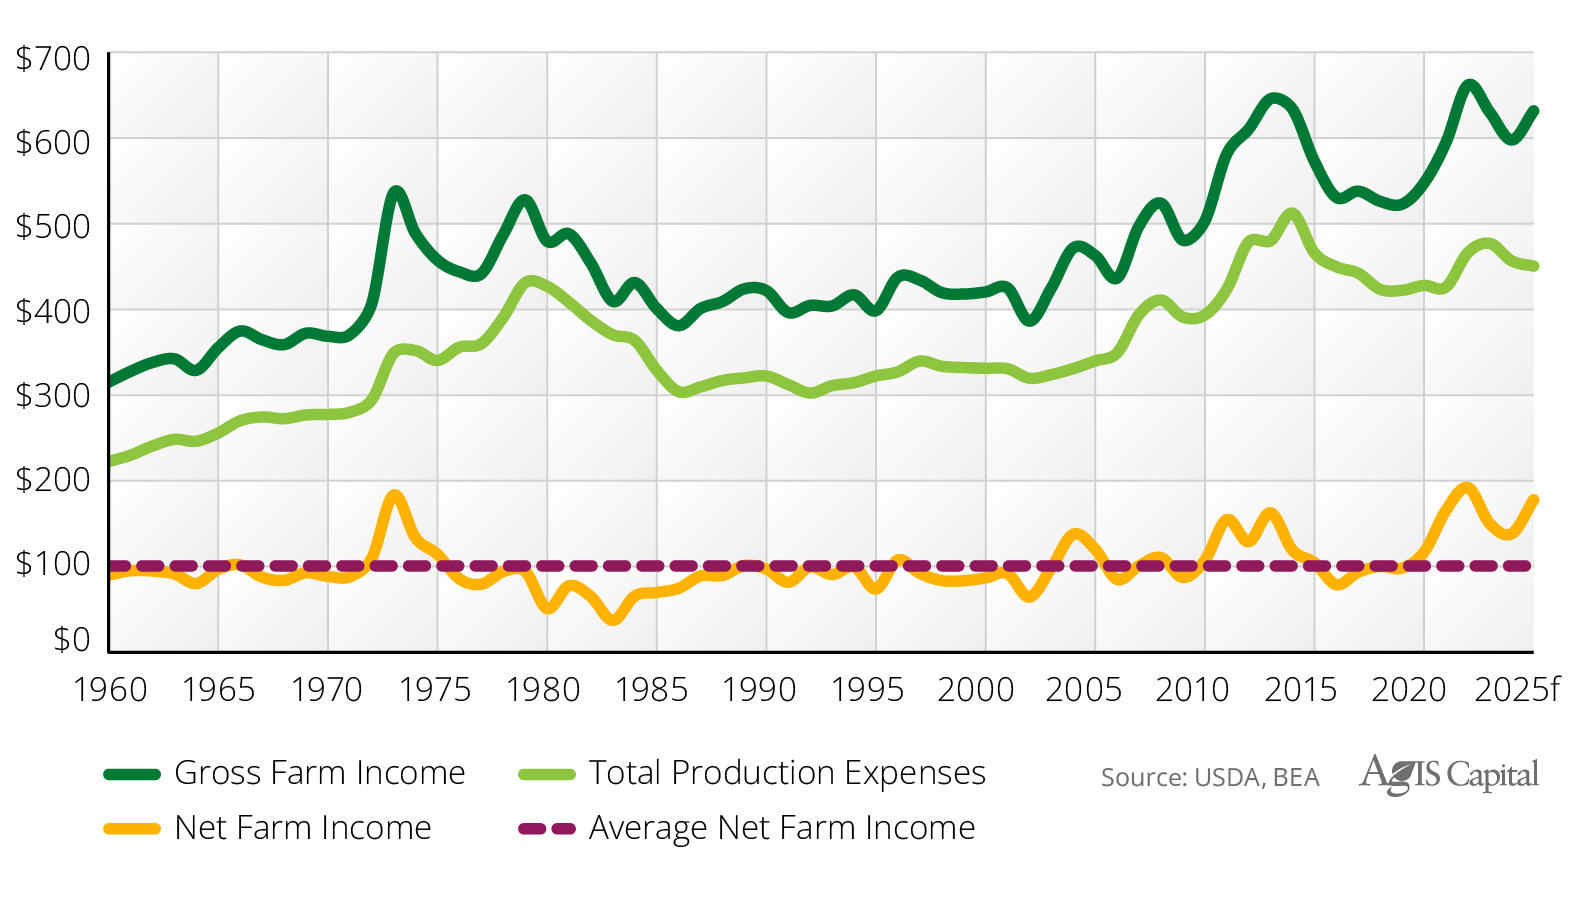
In real terms, total production expenses are projected to fall $6.1bb to $450.4bb in 2025. A 10.8 percent reduction in feed expenses and a 9.9 percent decrease in pesticides, fertilizer, lime, and soil conditioners contributed to a $12.8bb reduction in inflation-adjusted expenses. Livestock, poultry, and labor expenses saw the most significant cost increase, contributing an additional $4.1bb (see Figure 2).
Figure 2) Real U.S. Farm Income Components: 1960 to 2025f, billions, 2025 dollars
Given expectations for higher farm income and lower production costs, real net farm income (NFI) is projected to increase 28.5 percent to $180.1bb in 2025. In real terms, the 2025 NFI forecast is projected to be the third highest since 1960. The estimate would be 77.4 percent higher than the average between 1960 and 2024f and 39.5 percent higher than the average from 2010 to 2024f (as depicted in Figure 3). The past five years rank among the eight highest NFIs recorded since 1960.
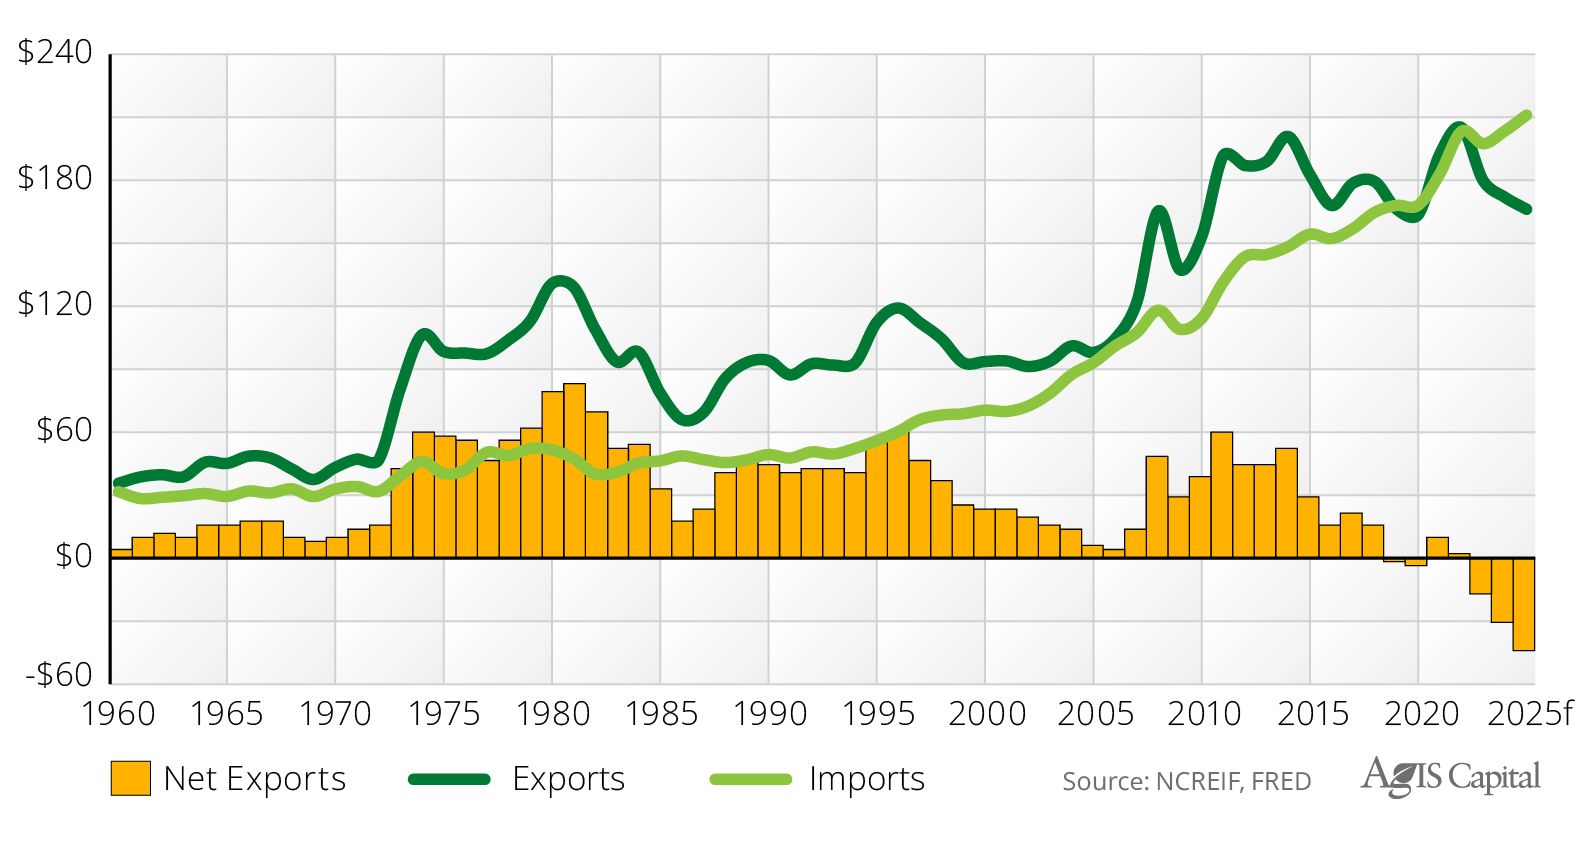
In real terms, U.S. agricultural exports are projected to decline 3.3 percent to $170.0bb due to lower expected export values of soybeans, beef, cotton, soybean meal, and sorghum. Agricultural imports are forecasted to rise 3.1 percent to $215.5bb. This would mark the third consecutive year of negative net exports and the largest trade deficit at $45.5bb (see Figure 4).
Figure 3) Real U.S. Net Farm Income: 1960 to 2025f, billions, 2025 dollars
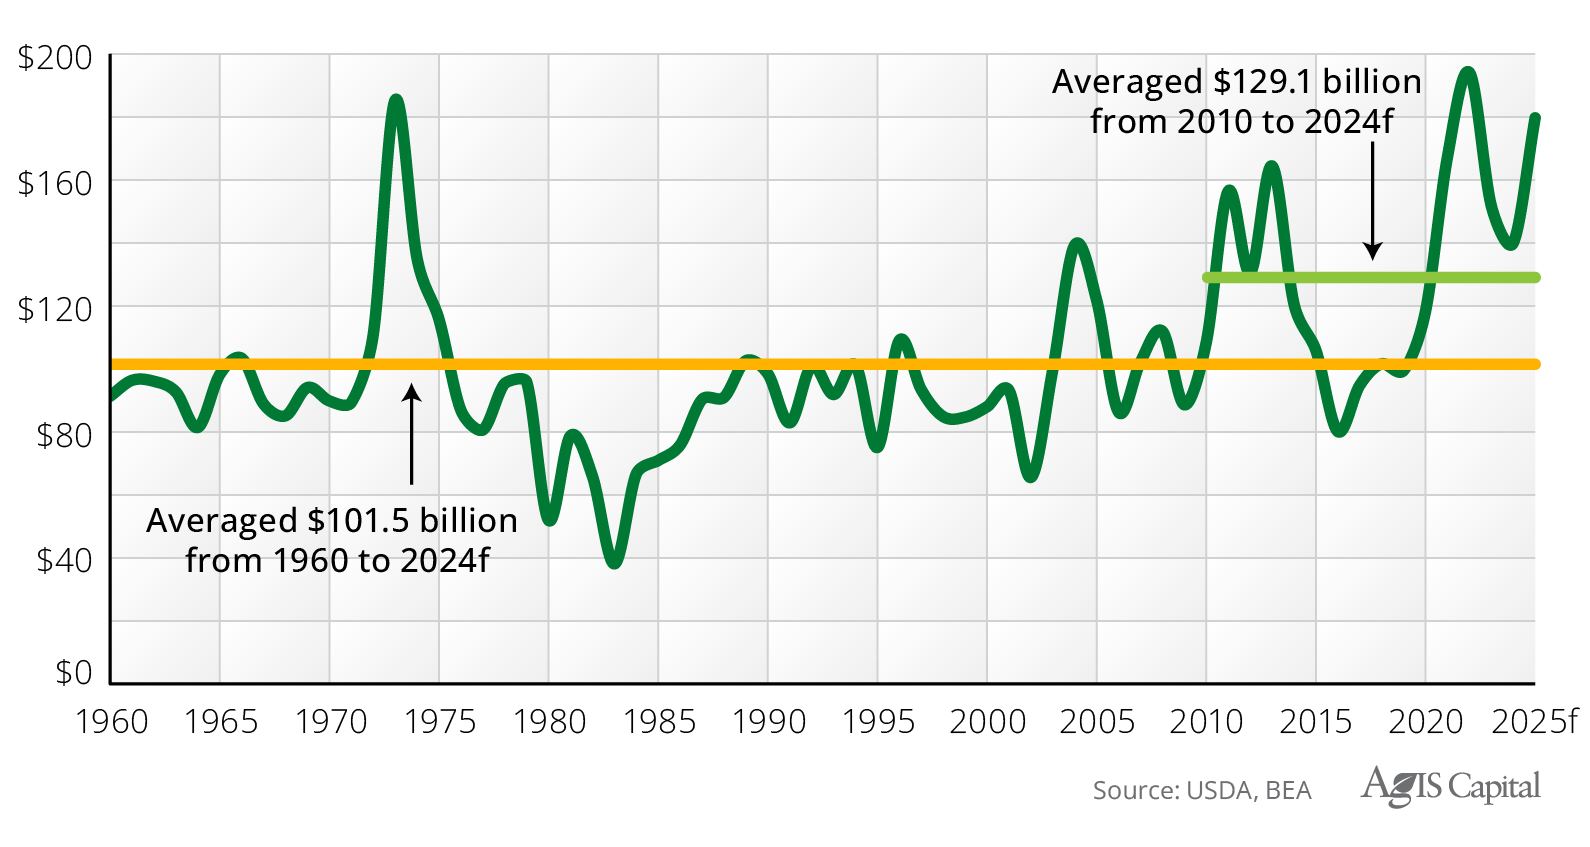
Figure 4) Real U.S. Agriculture Imports and Exports: 1960 to 2025f, billions, 2025 dollars
The real value of farm sector debt is projected to rise 2.8 percent to $561.8bb. Real estate debt is anticipated to grow 3.1 percent, reaching a record high of $374.2bb, while non-real estate debt is expected to increase 2.4 percent to $187.6bb, which remains 25.2 percent lower than the record set in 1979 (as shown in Figure 5). In general, the coverage ratios within the agricultural sector have maintained consistency over the past decade; however, this situation may change if output prices remain subdued and interest rates persist at elevated levels.
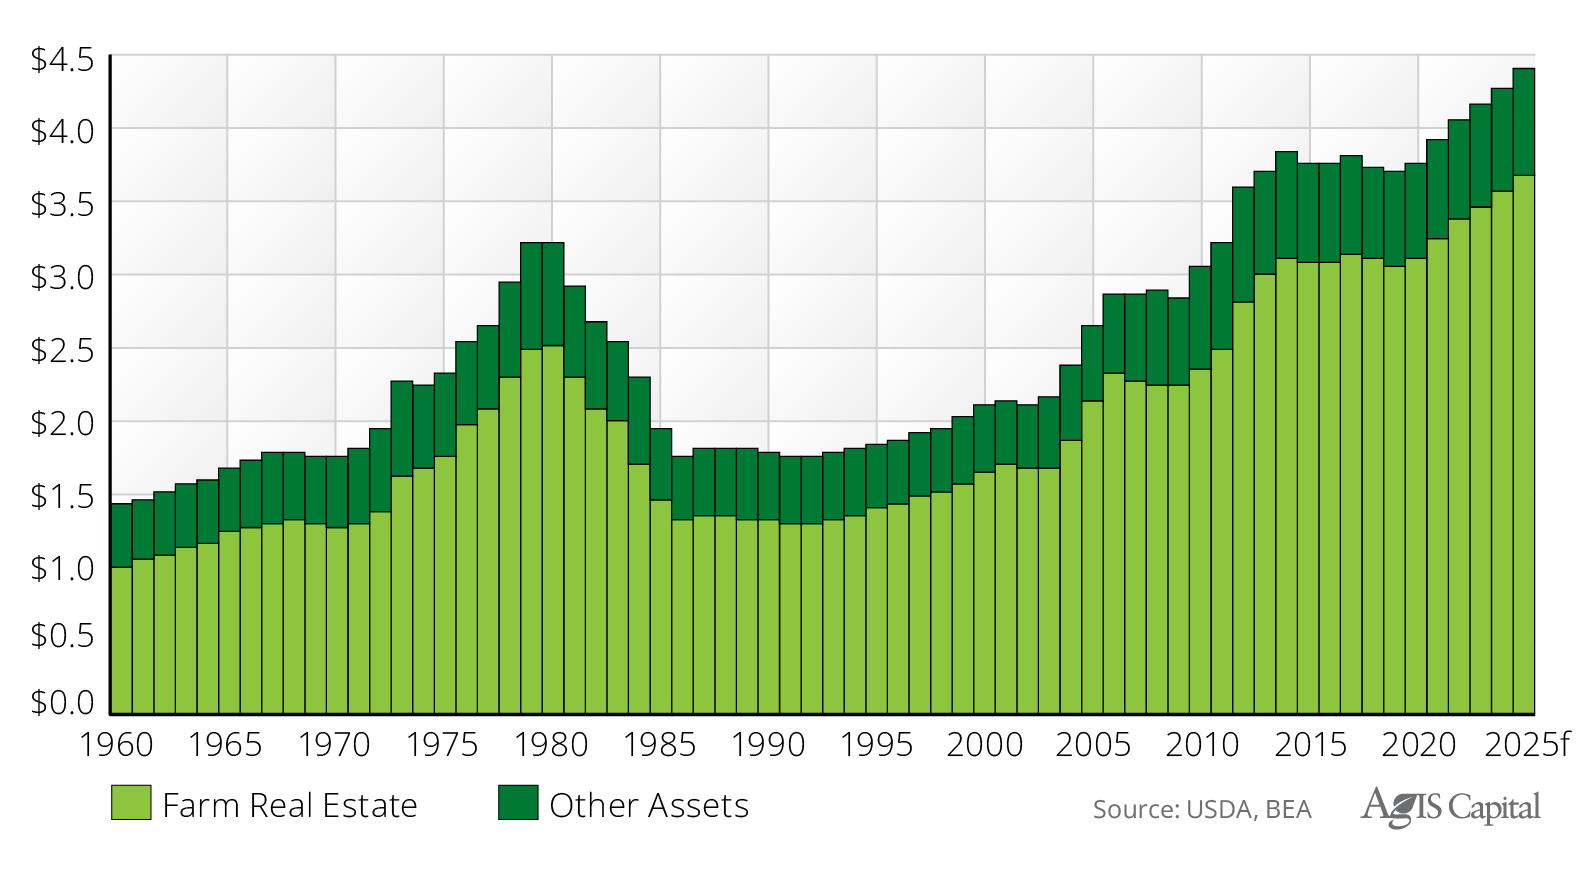
The real value of farm assets is projected to rise 3.4 percent to $4.4 trillion (tt), while the real value of farm real estate is anticipated to grow 3.5 percent to $3.7tt (see Figure 6).
Figure 5) Real U.S. Farm Debt in Real Estate and Non-Real Estate: 1960 to 2025f, billions, 2025 dollars
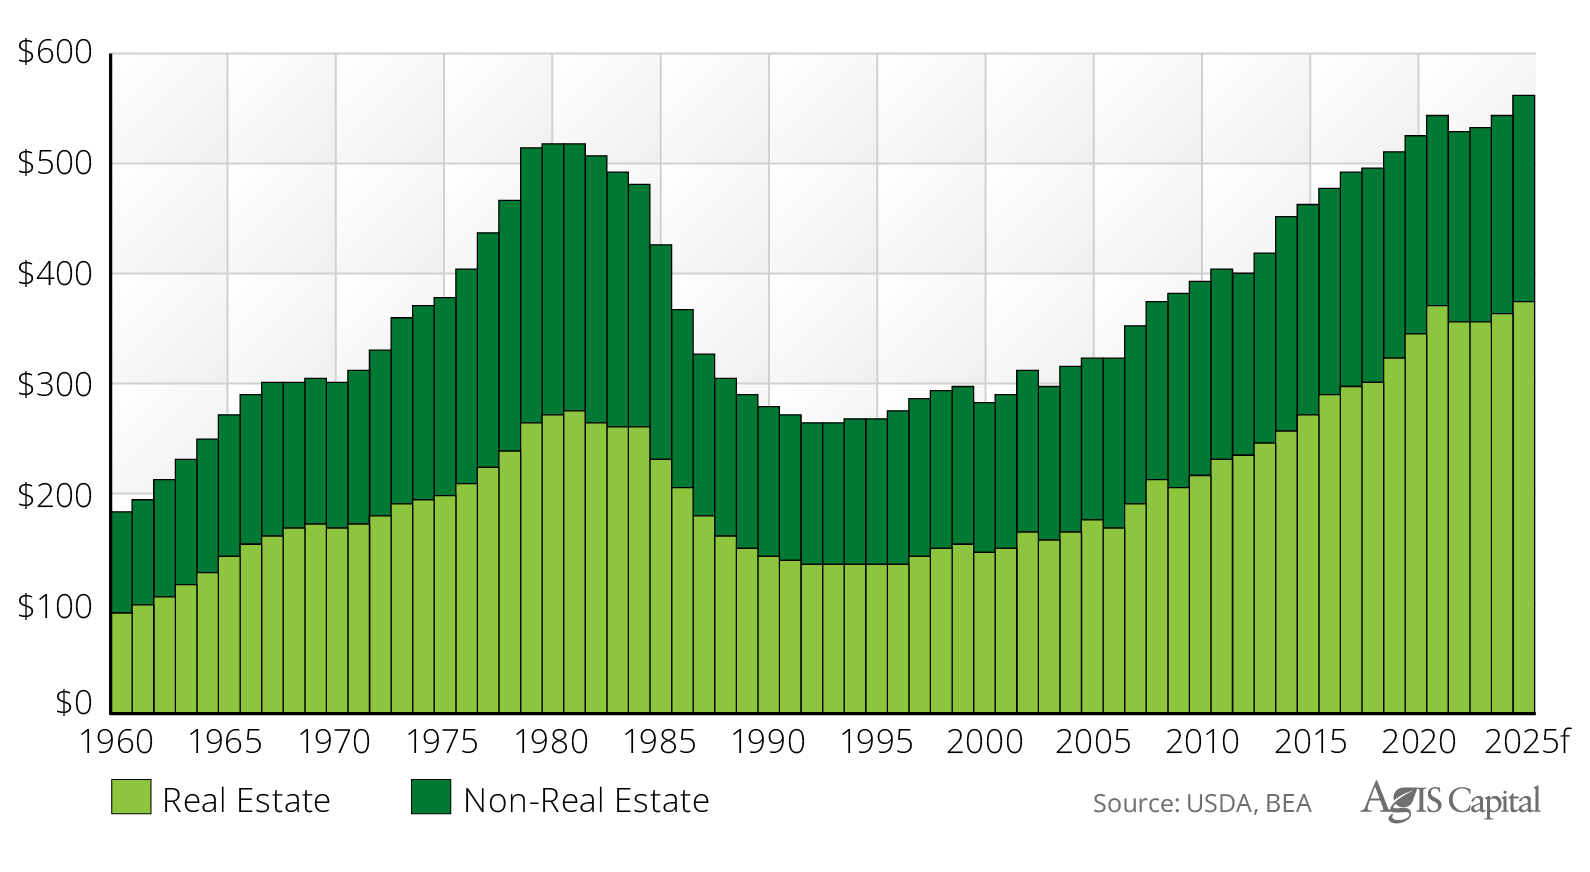
Figure 6) Real U.S. Farm Assets and Farm Real Estate: 1960 to 2025f, trillions, 2025 dollars
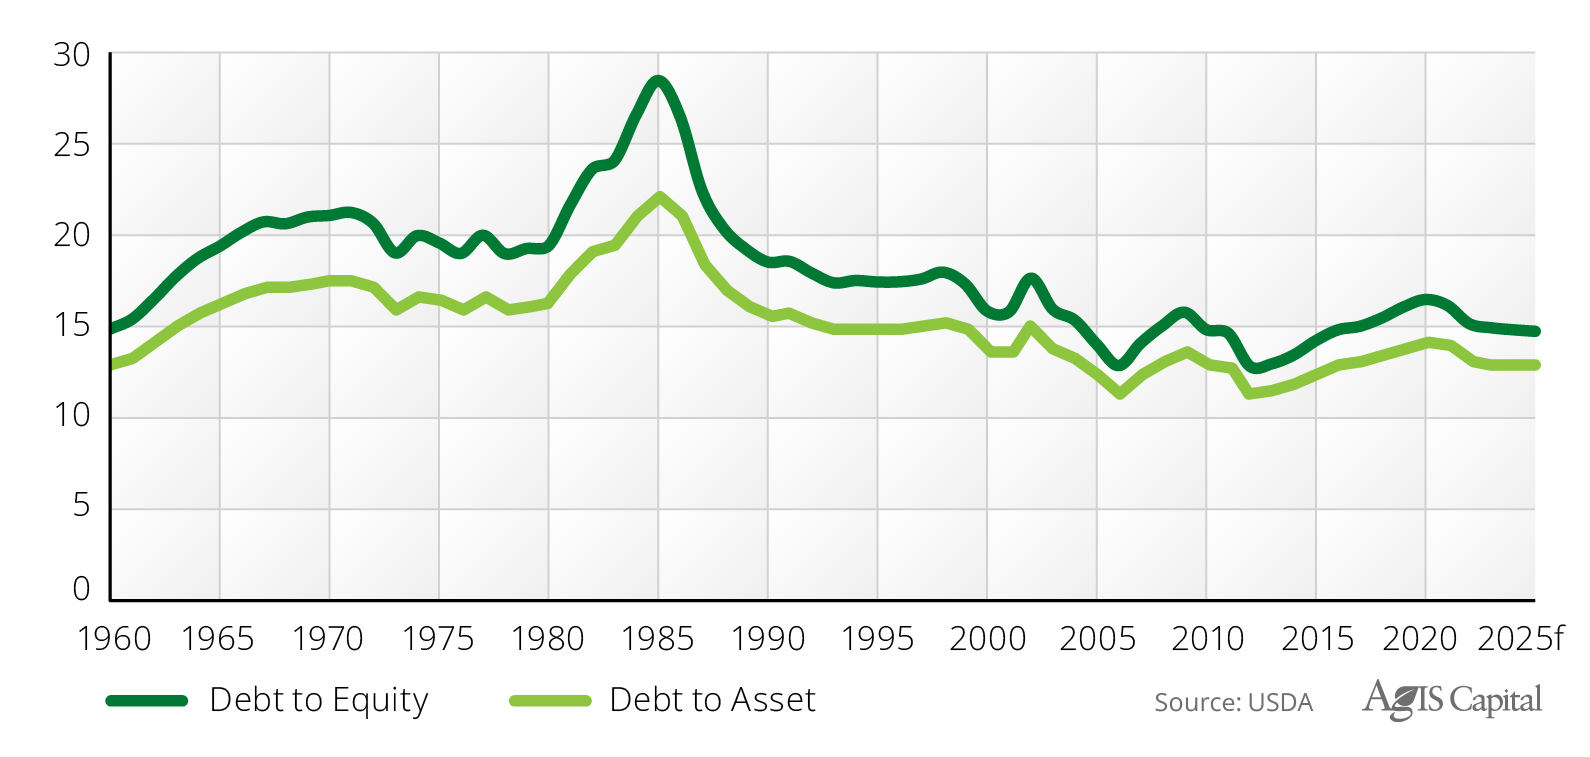
The real value of farm sector equity is expected to increase 3.4 percent in 2025 to $3.8tt. The higher proportional increase in the values of farm assets and farm equity, in comparison to farm debt, has resulted in a slight decline in the debt-to-equity and debt-to-asset ratios, decreasing by approximately half a percent to 14.6 percent and 12.8 percent, respectively, as depicted in Figure 7).
Figure 7) U.S. Farm Sector Debt Ratios: 1960 to 2025f
The USDA’s farm income and balance sheet forecasts provide a high-level overview of the profitability of the U.S. agriculture sector and reflect diverse uses, crop types, and geographies. To gain more insight into the current situation, we analyze the performance of the NCREIF Farmland Index, which provides more detail on the relative performance of various property and crop types.
The Farmland Index
For the first time since its inception in 1991, the NCREIF Total Farmland Index (TFI) recorded a negative annual total return. The index’s annual total return was -1.0 percent for the year ending December 31, 2024 (see Row 1, Column (g) in Figure 8). The income return stood at 2.5 percent, while the capital return was -3.5 percent. The TFI consisted of 1,023 assets, a net decrease of 316 properties from the previous year, mainly due to a manager leaving the index. The value of the TFI totaled $16.1bb, with an average property value of $15.7 million (mm).
Figure 8) NCREIF Farmland Returns: one- and five-year, annualized, million dollars
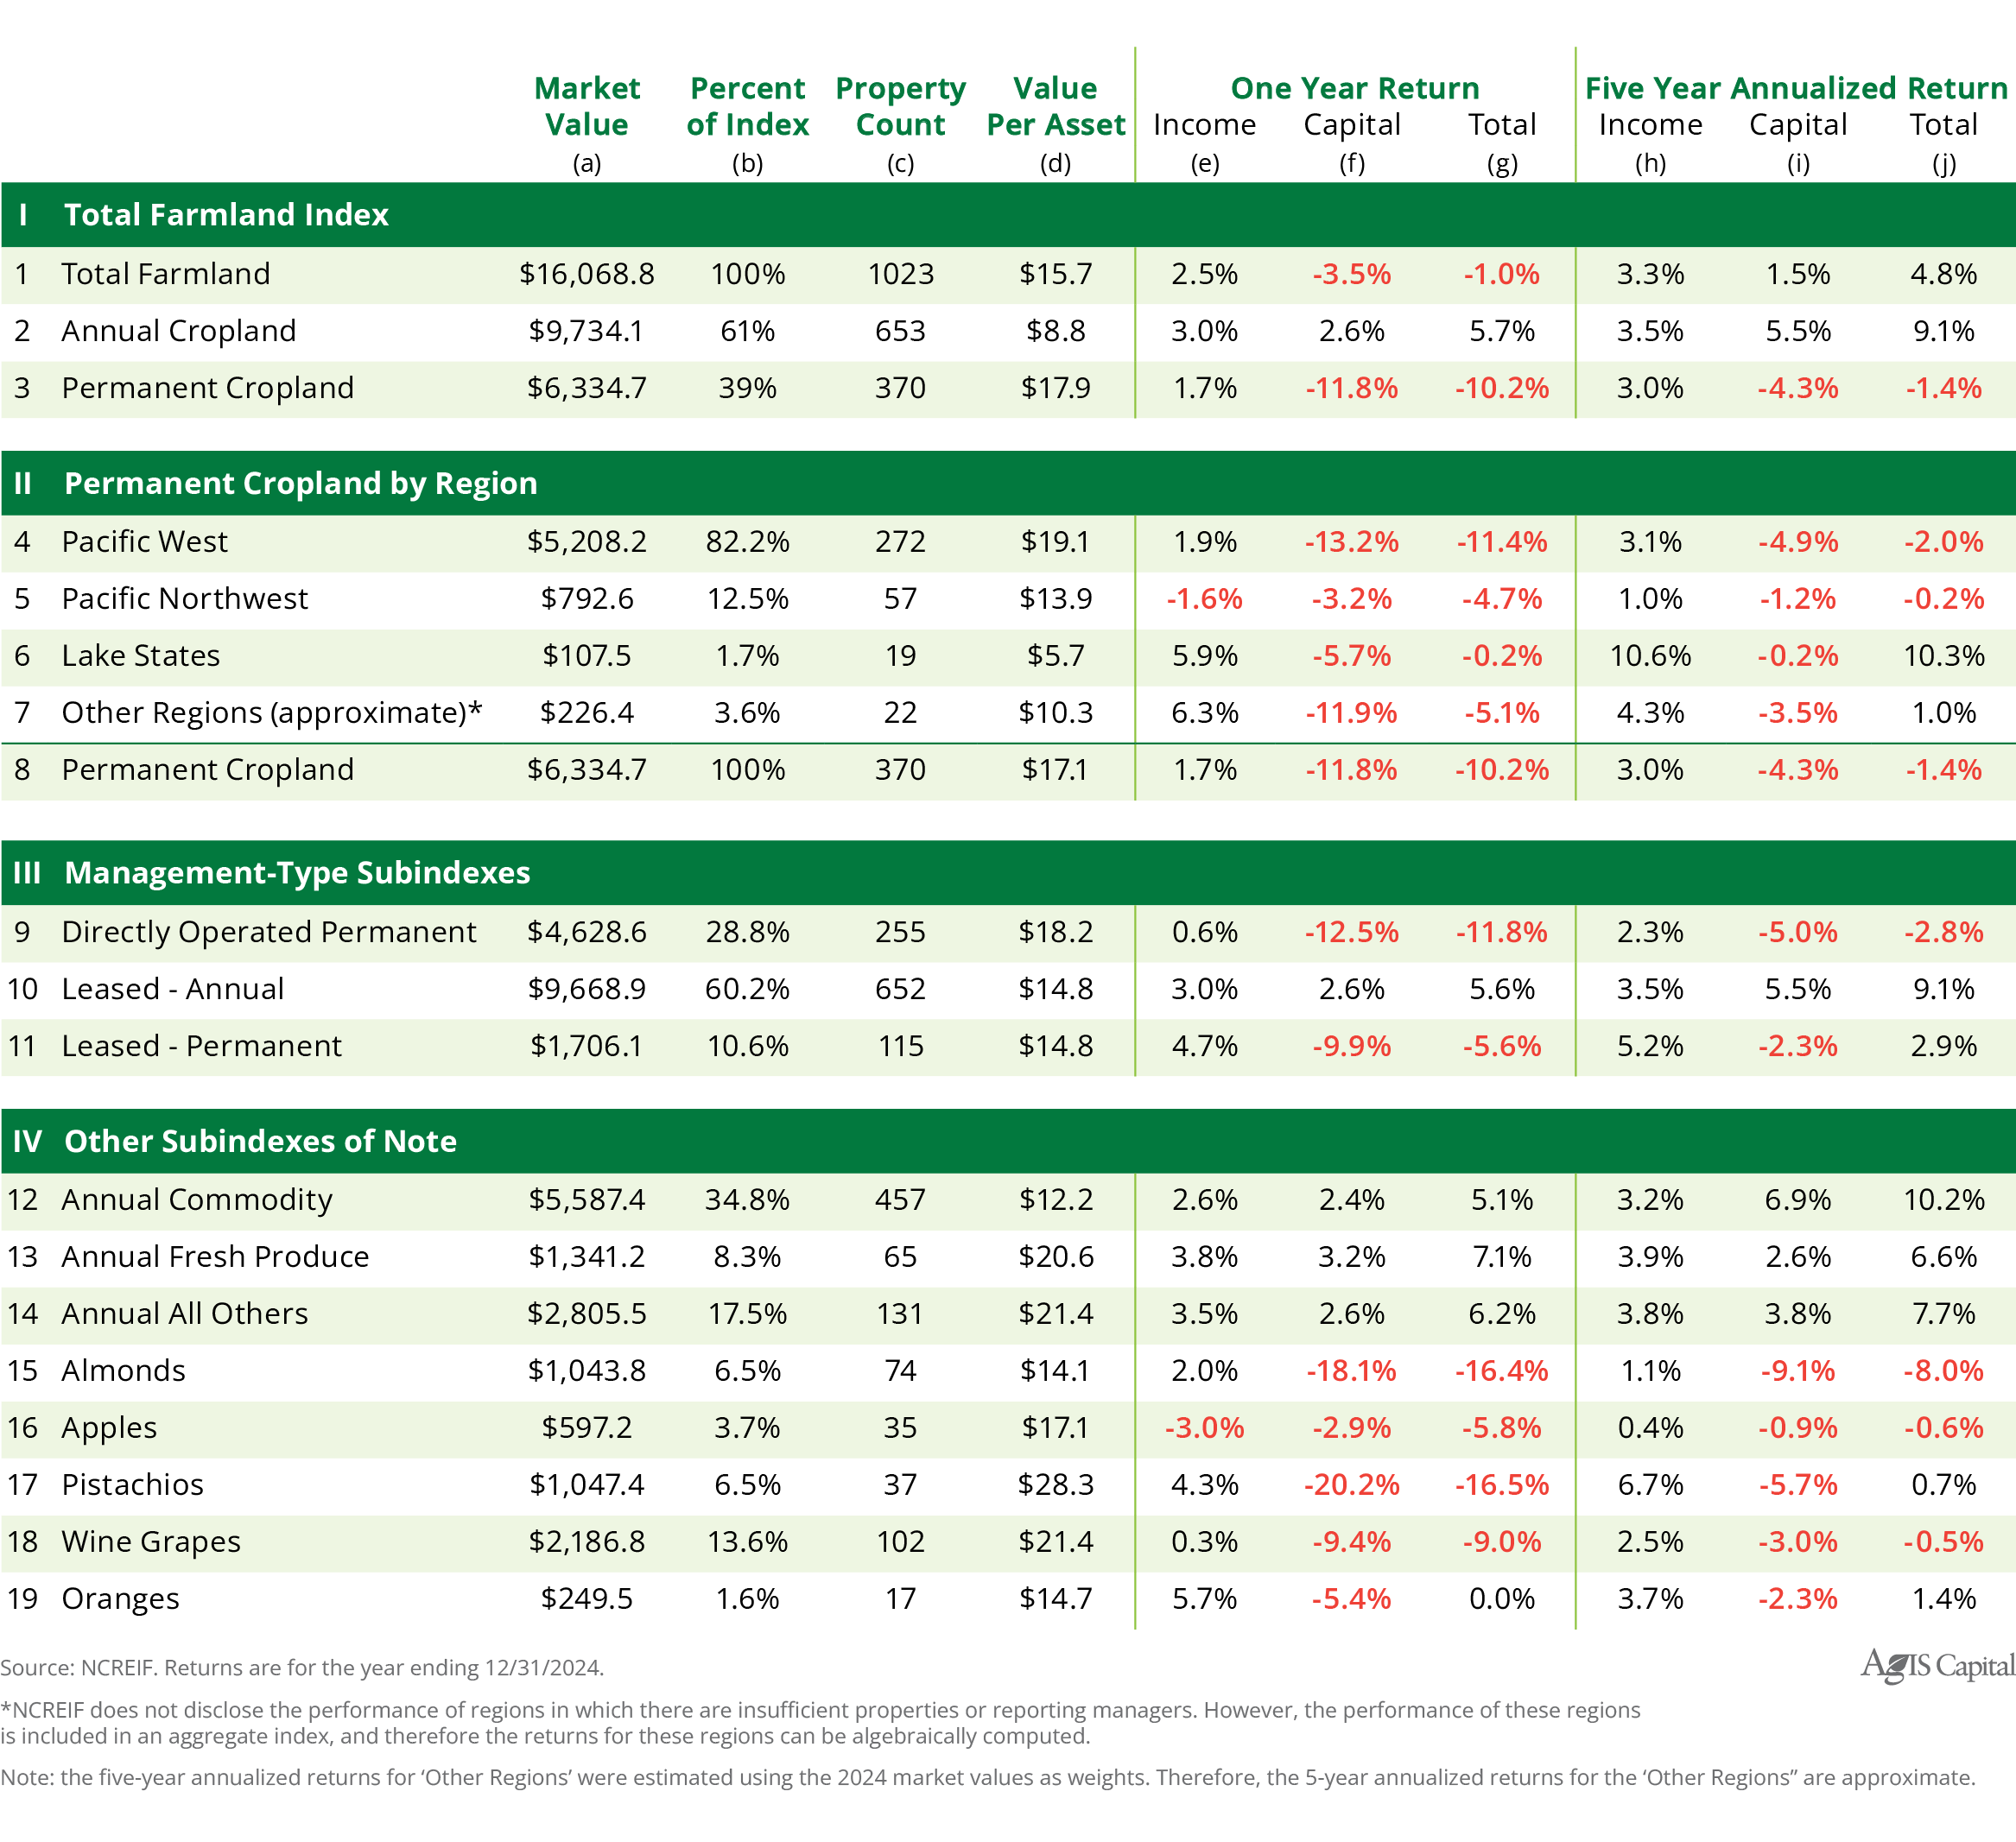
The Annual Cropland Index included 653 assets, reflecting a net decrease of 350 from the previous year. The index’s market value stood at $9.7bb, with the average value at $14.9mm per property. Annual crops delivered a total return of 5.7 percent in 2024, comprised of income returns of 3.0 percent and capital returns of 2.6 percent.
The NCREIF Permanent Cropland Index included 370 properties, a net increase of 34, primarily due to AgIS Capital joining NCREIF. The index’s market value was $6.3bb, with an average value of $17.2mm. The Permanent Cropland Index recorded a total return of -10.2 percent, with income returns of 1.7 percent and capital returns of -11.8 percent; all three represent the lowest since inception. Last year marked the second consecutive year in which the Permanent Cropland Index reported a negative total return. Notably, the Permanent Cropland Index has never posted a negative income return.
Other notable returns include the Corn Belt Annual Cropland Index, which posted a total return of 1.7 percent in 2024, comprising a record-low income return of 2.2 percent and a capital return of -0.5 percent. Despite the negative capital return in 2024, the Corn Belt Annual Cropland Capital Index increased 52.6 percent over the last four years, while the Income Index for the same region rose only 11.9 percent (see Figure 9). In total, four of the eight annual cropland regional indices—accounting for 69.6 percent of the Annual Cropland Index by value—recorded the lowest income rates of return since inception.
Figure 9) Percentage Change in the Row Cropland Capital Index from 2021-Q1 to 2024-Q4 and Current Income Return Rates, by NCREIF Annual Cropland Region

Because annual crops in the NCREIF Index are leased to tenant farmers, the rent farmers pay drives underlying land values, as land prices are a function of expected future cash flow and the opportunity cost of capital. The significant appreciation of annual cropland capital values since 2021, coupled with lower annual crop output prices, had reduced income return rates at a time when the opportunity cost of capital moved higher. For example, income returns for the aggregate NCREIF Annual Cropland Index fell below the annual average market yield on U.S. Treasury Securities at 10-year constant maturity for the second consecutive year in 2024 (See Figure 10)). This has not occurred since 2007. In a new, lower commodity price environment, tenant farmers will be less willing or able to pay higher annual cash rents, which, in turn, means annual cropland appreciation will slow or cease in the coming years, ceteris paribus.
Figure 10) Annual Cropland Returns and the 10-Year Constant Maturity Rate: 1991 to 2024
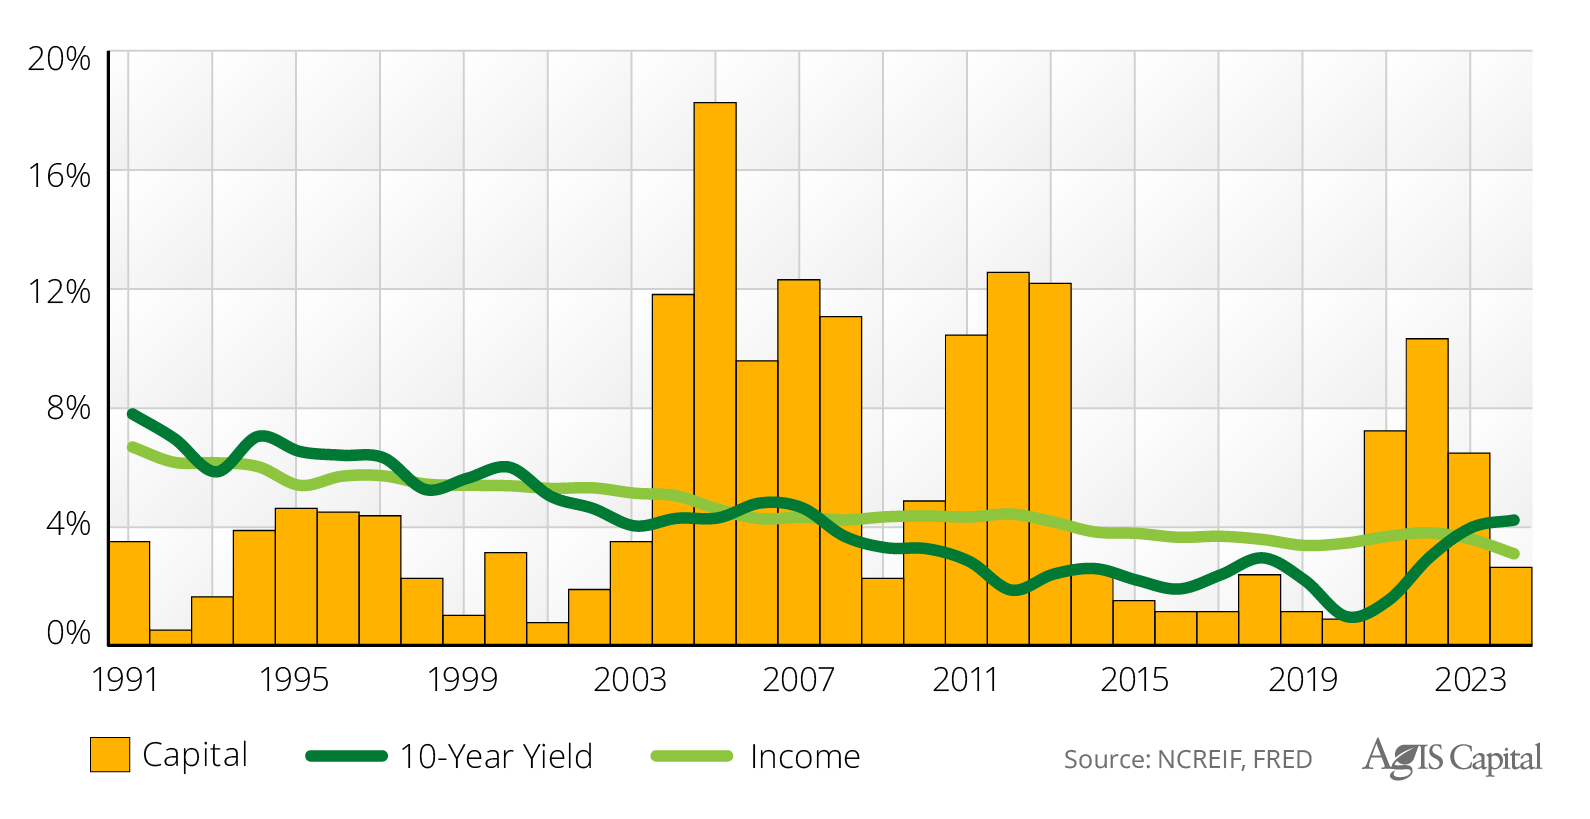
Since most annual cropland returns have come from capital appreciation since the NCREIF Index began (with annual capital returns at 5.2 percent and income returns at 4.6 percent), and given that the NCREIF Annual Cropland Income Return was 3.0 percent in 2024, it will be increasingly challenging for annual cropland investors to achieve high single-digit total returns without a meaningful rise in annual cropland prices or a notable drop in interest rates.
Regarding permanent crops, the NCREIF Pistachio Index experienced a record-low total return of -16.5 percent, comprising an income return of 4.3 percent and a capital return of -20.2 percent, following a capital return of -10.4 percent in 2023. Similarly, the NCREIF Almond Index also posted a fifth consecutive negative total return of -16.4 percent, with a 2.0 percent income return and capital returns of -18.1 percent.
Given the magnitude of these negative returns, the next section explores the historical performance of the NCREIF Almond and Pistachio Indices and their effects on the NCREIF Permanent Cropland Index.
Our Thoughts
In 2024, the NCREIF Permanent Cropland Index recorded its lowest total return ever, at -10.2 percent, marking the sixth consecutive year of negative capital returns. Overall, permanent cropland capital values have declined 20.4 percent since 2018. In contrast, the NCREIF Annual Cropland Capital Index has risen 31.8 percent during the same period. As a result of these changes in capital values, the NCREIF Annual Cropland Total Return Index since inception has surpassed the NCREIF Permanent Cropland Total Return Index for the first time since the third quarter of 2012, as portrayed in Figure 11).
Figure 11) NCREIF Total Return Indices for Annual and Permanent Cropland without: Q1-1991 to Q4-2024, quarterly
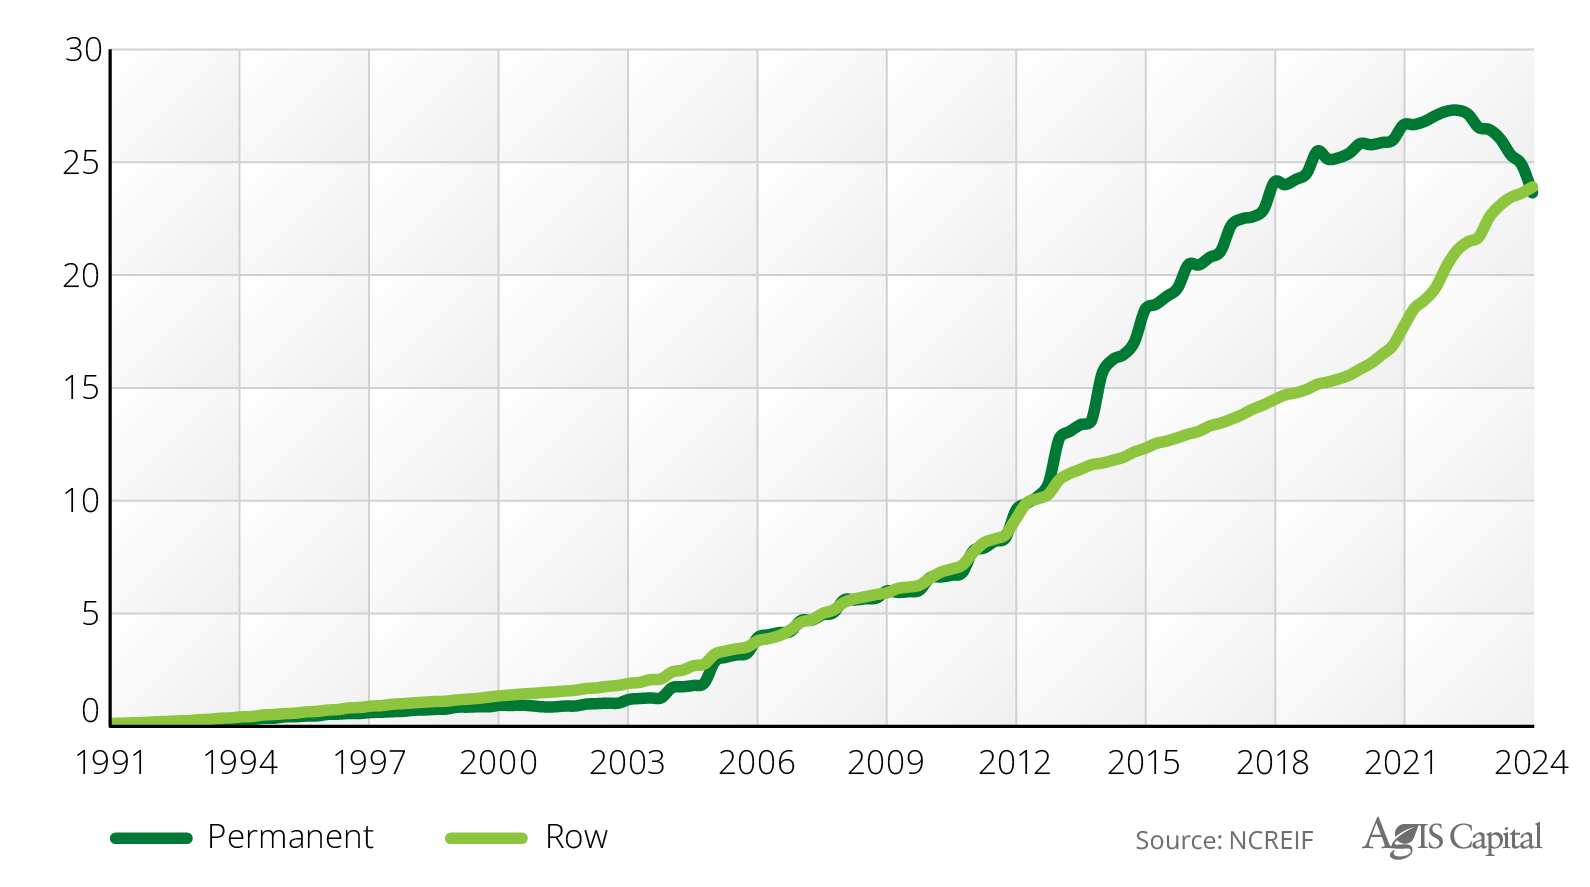
AgIS Capital Research (ACR) previously wrote about some factors causing the divergence between annual and permanent cropland returns. ACR also previously identified three culprits that have caused the poor performance of the permanent cropland returns since 2020: 1) supply chain impediments, 2) the supply response, and 3) the relative value of the dollar, and went on to elaborate on how the Sustainable Groundwater Management Act (SGMA) will bring about a new market regime. We now hear that higher capital costs are finally affecting profitability and farmland values.
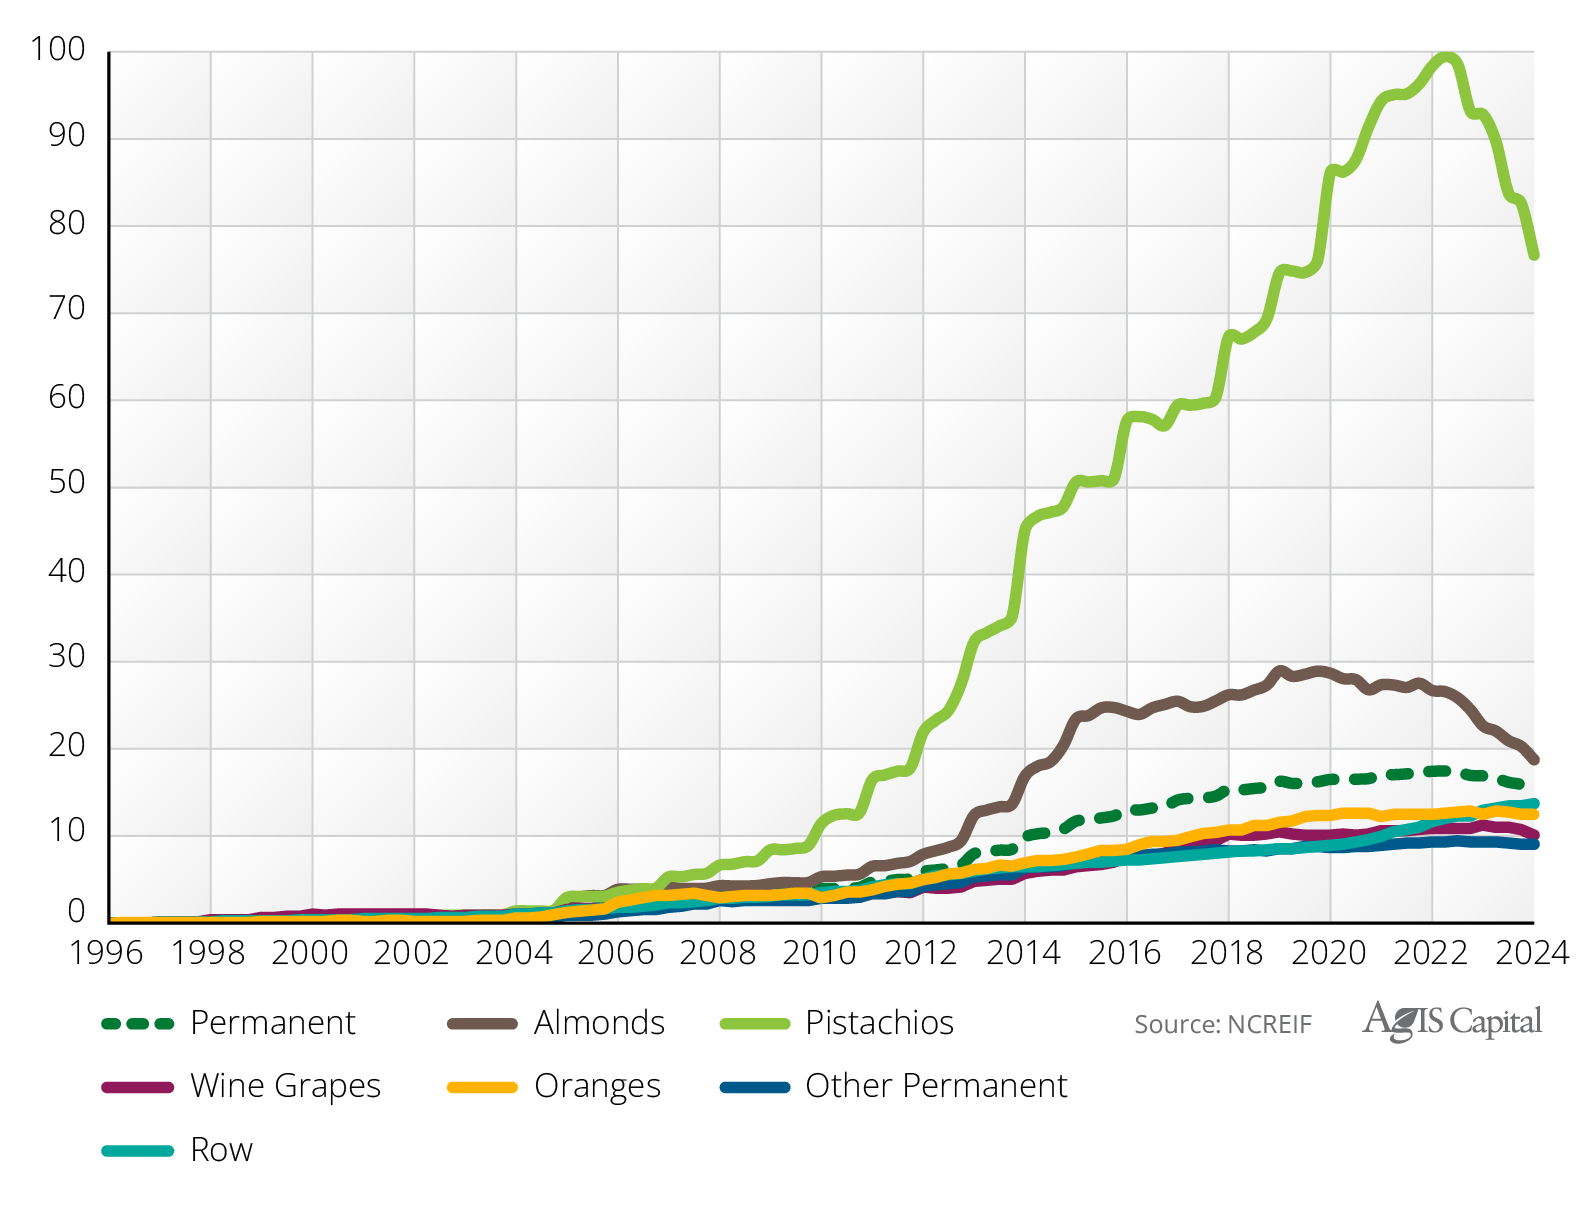
To better visualize the impacts of these market forces, Figure 12) portrays the NCREIF Permanent Cropland Total Return Index, four crop-type sub-indices, and an index for the remaining permanent cropland. Most apparent in Figure 12) is that pistachios have been the top-performing NCREIF total return permanent cropland sub-index, peaking in the first quarter of 2023 before falling 22.9 percent through the fourth quarter of 2024. Interestingly, the NCREIF Pistachio Capital Index peaked in the second quarter of 2015 and has since fallen 49.5 percent, while the NCREIF Pistachio Income Index has risen 145.4 percent. The NCREIF Total Return Index rose 62.7 over the period.
Almonds were the second-best performing permanent cropland index. The NCREIF Almond Total Return Index peaked in the fourth quarter of 2019. The Almond Capital Return Index peaked during the second quarter of 2016 and has since declined 63.7 percent, while the income return index rose 43.0 percent.
Figure 12) Quarterly NCREIF Total Return Indexes for Various Permanent Crop Types: Q1-1997 to Q4-2024
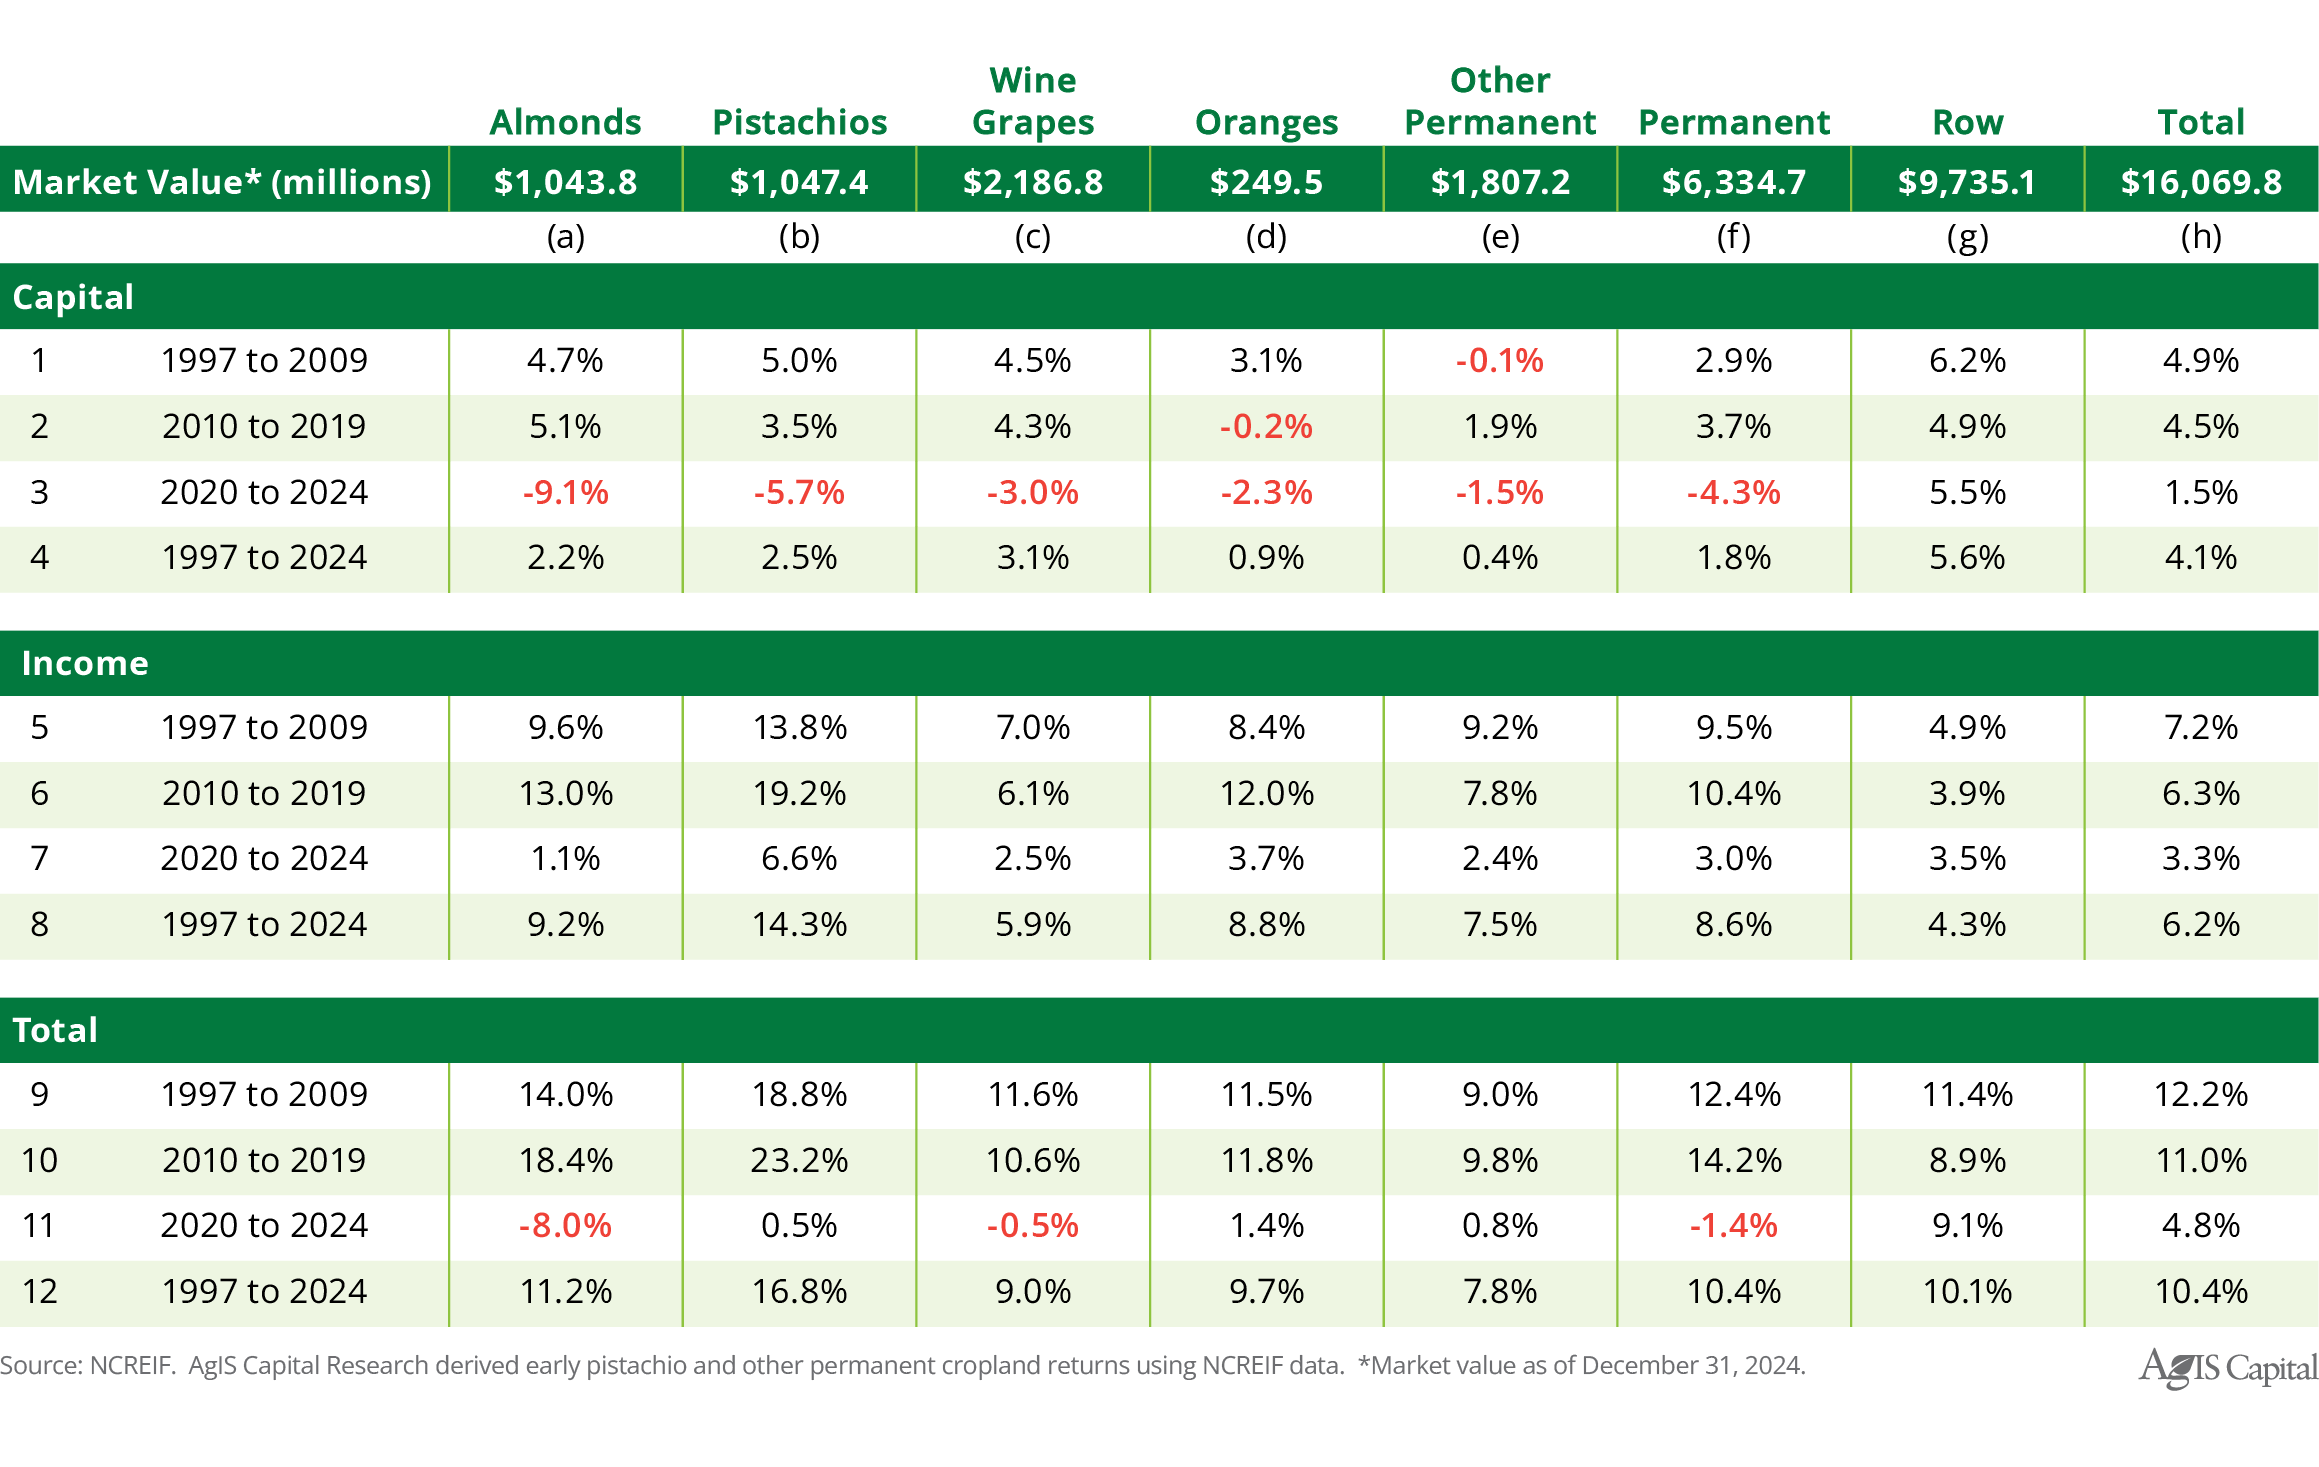
The market value of capital in almond and pistachio orchards has averaged only 36.0 percent of the value of the NCREIF Permanent Crop Index. Without them, however, the annualized total return since the inception of the Permanent Cropland Index would be 362 basis points lower, even after the subpar performance since 2020. Figure 13) presents the returns of the four longest permanent crop sub-indices in NCREIF (Note: The returns are from 1997 to 2024 and not since the inception of NCREIF in 1991. This was done because the NCREIF Wine Grape Index began in 1997). The annualized capital returns of almonds and pistachios between 2020 and 2024 (Row (3), Columns (a) and (b)) are significantly more negative than those of other permanent cropland capital returns. This reflects the fact that almonds and pistachios were widely planted throughout the San Joaquin Valley, often in areas with inadequate water rights.
Figure 13) Annualized Returns for Selected Crop-Type Over Various Periods
Conclusion
The NCREIF Permanent Cropland Index continued its disappointing performance in 2024 with a historically low total return of -10.2 percent. This decline was entirely attributed to the significant negative capital returns from pistachio and almond orchards. These very crop types have historically significantly enhanced the aggregate NCREIF Permanent Cropland Index.
Demand for almonds and pistachios remains strong, but a surge in supply has lowered output prices and reduced expected income, which in turn has reduced capital values. Additionally, the impending water supply constraint from SGMA legislation has reduced the long-term viability of an unknown but meaningful proportion of almond and pistachio orchards in the NCREIF portfolio, leading to a higher return variance for assets in the NCREIF Almond and Pistachio Indices. It will be interesting to see how much production capacity declines in these industries once SGMA is fully enacted.
Explore other reports by AgIS Capital
Contact
For more information on the investment services offered by AgIS Capital please contact us today.
Disclaimer: Our belief of future market performance is based on expectations that may or may not come true. Investors should perform their own due diligence before undertaking farmland investments. This material is copyrighted by AgIS Capital LLC and cannot be duplicated or used for any purpose without prior approval from AgIS Capital LLC.


